Oil price recovery, gold(XAU/USD)Silver(XAG/USD)Stick to the high ground

2023-11-27 16:50| Publisher: 2233| see: 451| comment: 0

abstract: Gold, Silver, and Oil Forecasts: Gold, Silver Forecasts: Neutral as We Continuously Accept 2000 Before the US dollar level, gold still faced downside risks. Silver has broken through the downward trend line and is expected to rise further. Delayed OPEC+The meeting will be crucial for the potential recovery of oil prices. Gold and Silver Prices This Week Table ...

goldSilver and oil forecasts:

goldsilverPrediction: Neutral

  • We continue to accept 2000 Before the US dollar level, gold still faces downside risks.
  • Silver has broken through the downtrend line and is expected to further rise.
  • Delayed OPEC+The meeting will beoil priceThe key to potential recovery
Gold and silver prices have performed well this week, and buyers aredollarWith the help of weakness, support is provided for these two metals.Both gold and silver are facing selling threats this week, but buyers have maintained price stability for most of the shortened trading week.However, as far as gold is concerned, it has not been able to 2000 dollar/Finding acceptance above the ounce mark may make precious metals fragile next week.

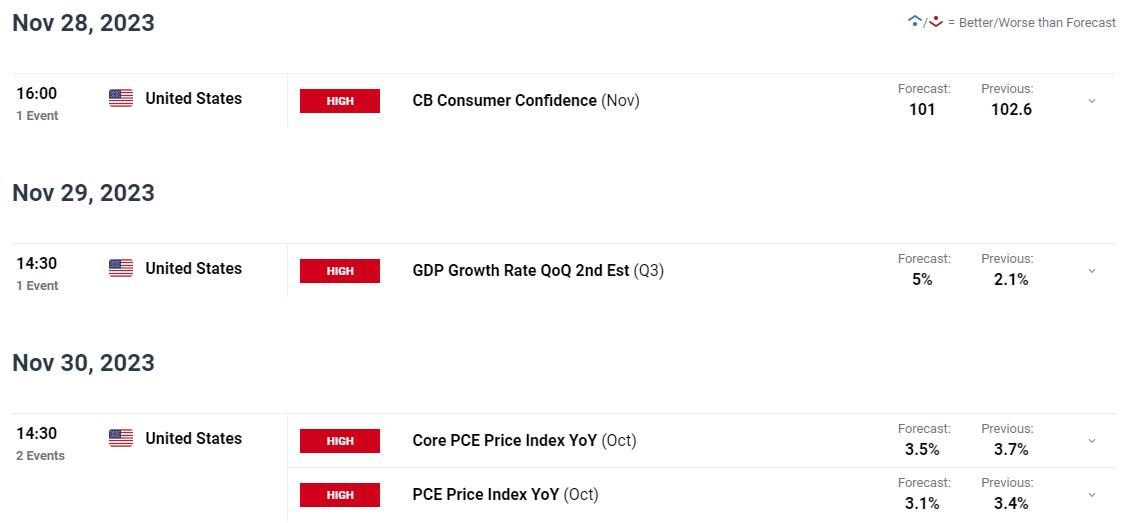
ISM Data and Core PCE It's the key

As the Middle East enters a long-awaited cooling off period, US data may become a key driving factor for gold prices, at least at the beginning of this week.Next week will be a busier week with no holiday disruptions, and a large amount of high impact and moderate impact data will be released.

The key events that may trigger fluctuations in the US dollar and gold prices may be ISM Data, and of course, the Federal Reserve's preferred inflation indicator - core PCE dataThe market has accepted it 2024 The idea of annual interest rate cuts has been priced at around 90 One basis point. Personally, I have complex feelings about my expectations for the future because I do believe that as consumers feel pressure, demand will face limitations, but I prefer to see some signs that the job market is cooling down.

I expect the brief buying and selling after the data release to continue in the coming week, but I don't expect either of these data to change the overall outlook.Before the end of the yearWe still have 12 monthNon agriculturalEmployment Data and Federal Open Market Committee(FOMC)Meetings and inflation data.Therefore, before the Federal Reserve announces the end of its interest rate hike cycle, market expectations for the Fed's rate hikes may continue to change.As we have seen recently, this may send a mixed signal for gold prices, and we may not be able to accept higher than before the end of the year 2000 dollar/The ounce mark.

Oil price recovery, gold(XAU/USD)Silver(XAG/USD)Stick to the high ground616 / author: / source:Oil price recovery, gold(XAU/USD)Silver(XAG/USD)Stick to the high ground954 / author: / source:

The technological prospects of gold and silver

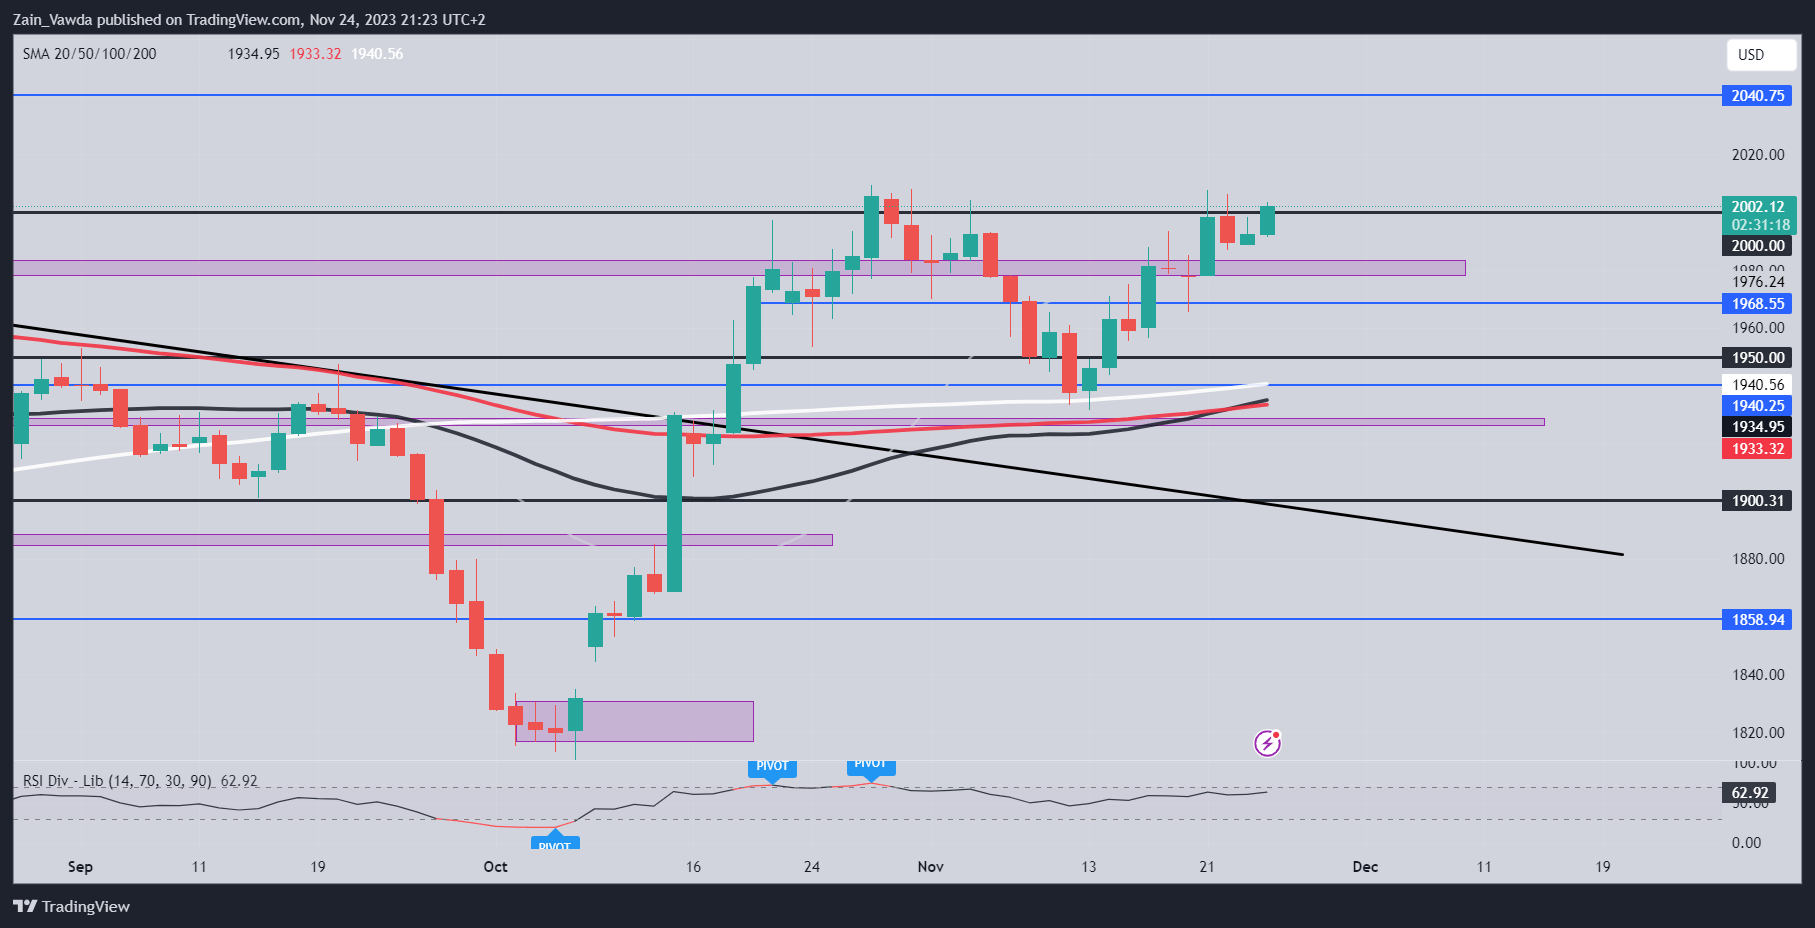
From a technical perspective, gold prices are expected to close at 2000 dollar/Above the ounce mark.However, as already discussed, the closing price above may not last as long as the recent situation.

The gold price needs to be cleared first 10 Month high point 2009 dollar/Direct resistance near the ounce mark.This will be a step towards 2000 The first step to accept above the US dollar level, otherwise we may experience a deeper pullback.

The key support areas that need attention are located 1990.00、1980.00 and 1968.00 Probably around last week 1931.65 Provide support before the low points on both sides take effect.

Gold(XAU/dollar Daily chart – 2023 year 11 month 24 day
Oil price recovery, gold(XAU/USD)Silver(XAG/USD)Stick to the high ground638 / author: / source:

Source:TradingView

silver (XAG/dollar)

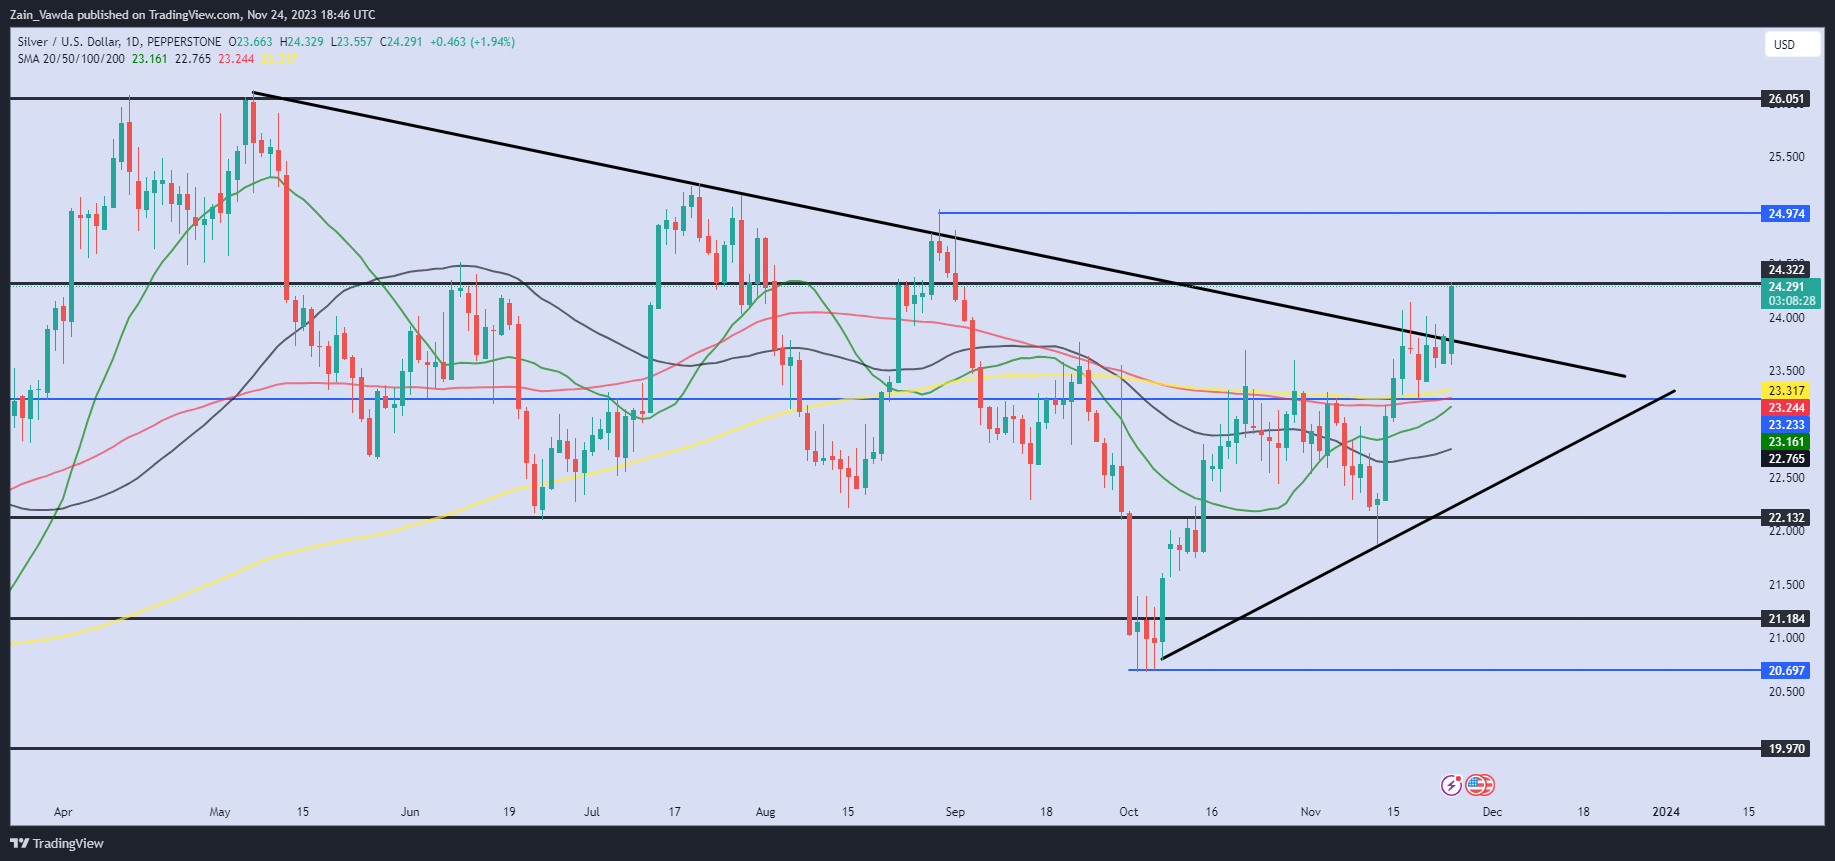
Breaking through the long-term downward trend line and staying in the key resistance zone at the time of writing this article(24.30)Afterwards, the interpretation of silver prices became clearer.After much hesitation this week, silver experienced a very bullish day on Friday.

Entering next week, the daily candle closing price on Friday will be very important.If the daily candlestick chart closes at resistance level 24.32 Above, it may move towards resistance at the beginning of this week 24.97 Advance.Alternatively, if we fail to close 24.32 Above, a pullback will be conducted to retest the trend line before it may continue to rise.In fact, we have already reached higher highs, which may lead to a pullback before continuing to rise.

Key levels to focus on:

Resistance level

  • 24.32
  • 24.97
  • 26.00

Support level

  • 23.80
  • 23.23
  • 22.76

Silver(XAG/USD Daily chart – 2023 year 11 month 24 day
Oil price recovery, gold(XAU/USD)Silver(XAG/USD)Stick to the high ground359 / author: / source:

Source:TradingView

Oil prospects

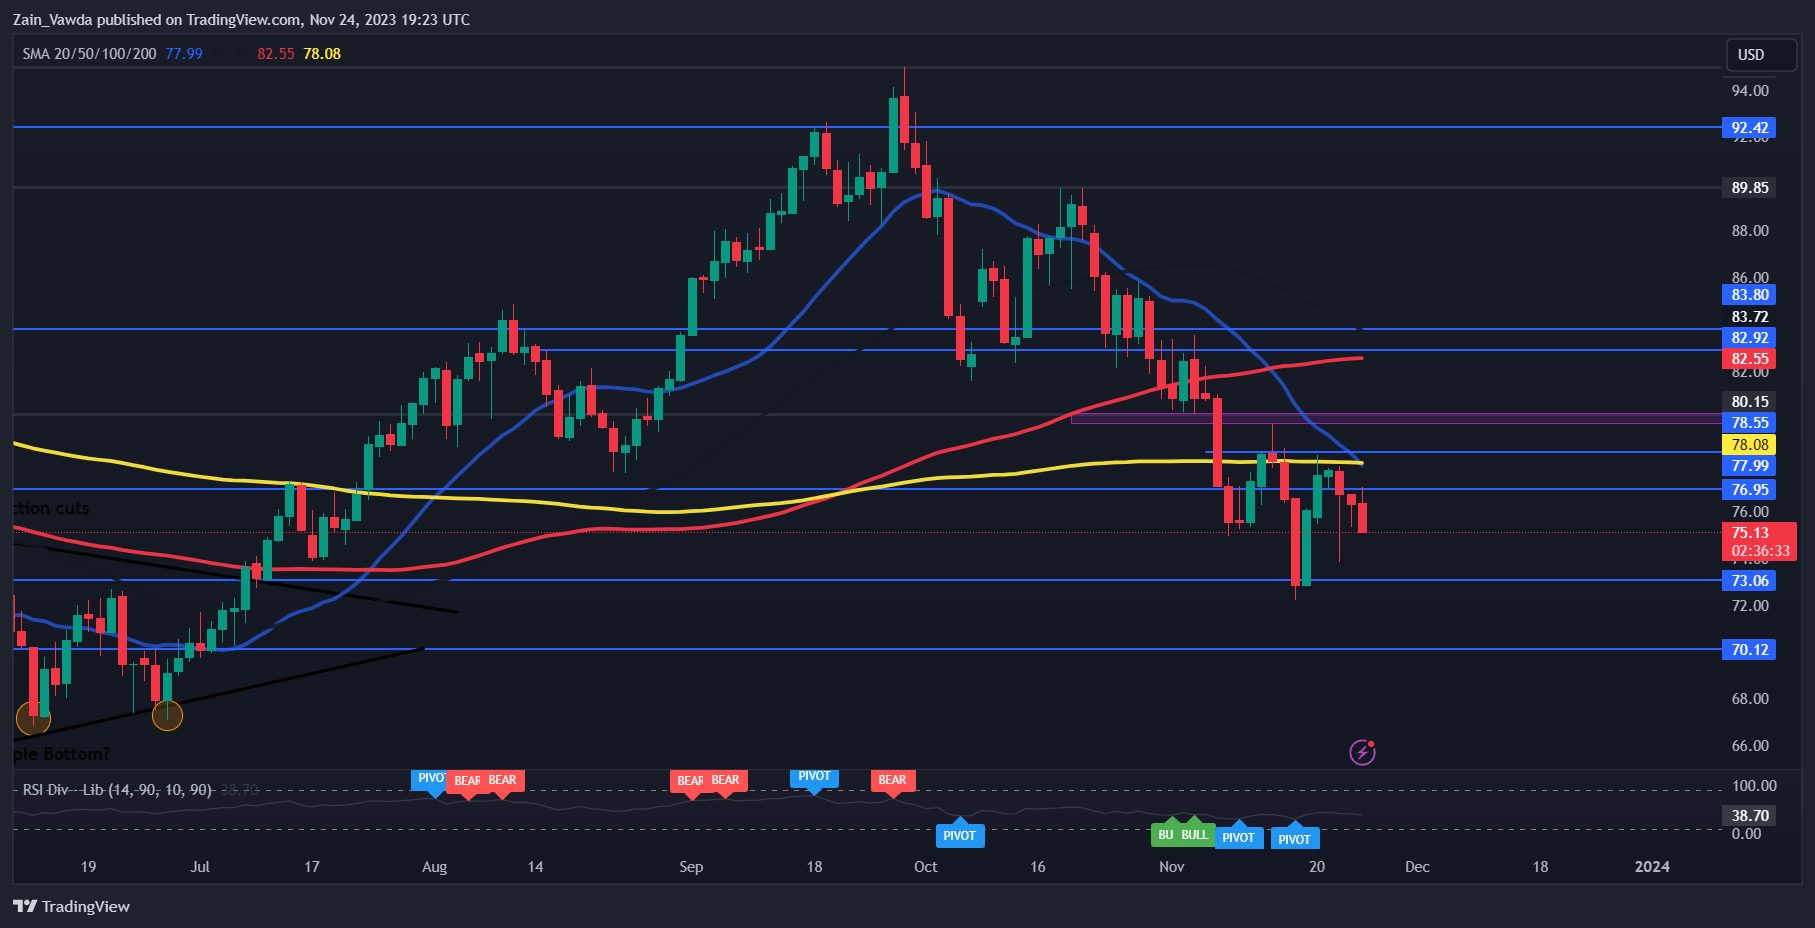
petroleumThe price has gone through an interesting week with significant fluctuations.After the bullish trend on Monday and Tuesday, it seems that oil prices are about to recover, and then OPEC+ The news of the meeting caused a brief panic in the market.Due to the concerns of various countries 2024 There are increasing rumors of disputes over annual production data,OPEC+ Announce the postponement of the meeting.

Especially African producers seem to be at odds with other members, which seems to be a waste of energy.I say this because if demand decreases as expected and production is not reduced, oil prices will fall as inventory increases.However, on Friday, it was reported that OPEC+We are approaching a compromise with African oil producing countries as Angola and Nigeria, which had hoped to increase production, seem to be shifting.

This will obviously be postponed until 11 month 30 The meeting held on the day added an extra layer of conspiracy. The meeting is expected to be held in a virtual format, according to sources 99% The certainty will reach an agreement.This will be the biggest risk facing oil prices in the coming week and may provide a catalyst for sustained recovery.

WTI Oil Daily Chart – 2023 year 11 month 24 day

Oil price recovery, gold(XAU/USD)Silver(XAG/USD)Stick to the high ground762 / author: / source:

Source:TradingView

In terms of price trends, we are still bearish and will print lower highs and lows.Price refused 200 Daily moving average, and pay attention to each barrel 73 The recent low near the US dollar.The lower support is located 71.50And then the psychological barrier 70.00 Become the focus.From a technical perspective, the downward trend does seem to exist because 20 Daily moving average below 200 The daily moving average did indeed show a death cross.This is clearly a good sign for further decline.

Considering the potential for an increase, the first area of interest will be 200 Daily moving average and 78.00 The fluctuating high point near the checkpoint.If we want to see structural changes and signal a bullish price trend, the daily candle closing price must be above that level.upper78.00At the checkpoint, the resistance level is at80.00Gateway.

"Small gifts, come to Huiyi to support me"
No one has offered a reward yet. Give me some support

Latest comments

Back to top