Register now, make more friends, enjoy more functions, and let you play in the community easily.
You need Sign in Can be downloaded or viewed without an account?Register Now 
x
Message surface parsing:
The primary focus during the European period is on the eurozoneGDPdataGDPUndoubtedly, it is one of the most important indicators reflecting the economic performance. The current median survey expectation shows that the second quarter of the euro zoneGDPWill grow2.1%, better than the previous value, the previous value is1.9%This optimistic expectation may boost the euro in the early stages of data release; If the exchange rate rises before the data is released and the actual data meets expectations, the euro may fall due to the exhaustion of positive news and boost the US index; If the actual data is better than expected, it will boost the euro and suppress the US index in the short term; If it falls short of expectations, it will benefit the US index and suppress the euro.
The New York period mainly focuses on the United StatesPCEPrice index data, the median of current survey expectations, the United States6monthPCEThe price index will increase1.3%, slightly lower than the previous value; This data is a preferred inflation measure by the Federal Reserve when formulating policies, and its actual performance will be positive in the short term/Bearish on the US dollar index and simultaneously negatively impacting non US currencies andgoldPrice. In addition, the New York time slot will also announce the United StatesISMSelf built industryPMIIt may also have a certain impact on the market situation, and investors need to pay attention to it.
Gold Technology Analysis:
The golden monthly line closed yesterday, with a bottoming bullish line and a bottoming bullish line. The bottom is expected to see a sharp riseKThe line shape is expected to continue to rise in the future, but prices are still consolidating5Within the consolidation period of months, focus on the closing line for next month. Once it breaks through, the bulls in the monthly line sector will open up in the future; From the daily chart of gold, due to the close of the monthly line and intense long short game, bulls have a slight advantage. However, yesterday's high closed slightly bearish, and there is a need for further adjustment in the short term. From the perspective of the US index, the US index has fallen below the bull bear boundary, and the US index will continue to decline in the future, which will continue to boost the price of gold in the future.
Gold from4From the hourly chart, it can be seen that the platform has not changed its trend of breaking through the previous top and bottom conversion. Currently, gold is closing at a high level with a bearish trend, and the Bollinger Bands are shrinking. The indicatorsRSIThere is a sign of a turning head downward at a high position, and at the same time, the bubbles have already formedKLine by line, gold is expected to continue to fluctuate and adjust today, waiting to stabilize before continuing to lay out multiple orders; From the one hour chart, it can be seen that gold has fallen into a range1271-1265The Bollinger Bands are currently flat due to their oscillations,RSIThe indicator turns downward from a high position,StochThe indicator has a high dead cross, and in the short term, it will face range fluctuations. Due to the trend being biased towards bullish operations, stepping back on the bottom can continue to lay out long orders. Pay attention to the above within the day1274and1280First line, follow below1264and1260Frontline support, intraday strategy suggested by Xiao Yufan to fall back and buy on dips.
Suggestions for intraday gold trading: Fallback1264-1266Multiple orders in the vicinity, stop loss4USD, target1275, hold against the limit.
Silver Technology Analysis:
Silver has been on an upward trend, with bullish positions being very strong and constantly breaking new highs. Both weekly and monthly trends have shown signs of bottoming out. Therefore, we believe that silver players can trend their trading layout and take profits by placing multiple orders, waiting for a new wave of rebound. Bulls may need to hold on for half a month, but this wave of upward momentum is still very large, and short-term silver is also bullish. From the daily chart, silver shows a high closing positive cross star, with the Bollinger Bands opening upwards and the bullish trend remaining unchanged. The indicatorRSILocated at a high position,StochThe indicator has a high dead cross, and there is a need for correction in the short term; from4Looking at the hourly chart, the high point has refreshed the previous high point, while breaking the downward trend line that suppressed the previous period. The bullish trend continues, and the future is expected to further rise. However, the short term is still affected by the previous high point16.9First line suppression, waiting for the return step to stabilize before entering the field with multiple orders; from1Looking at the hourly chart, the Bollinger Bands open upwards, while the bullish trend remains unchanged. However, in the short term, silver closes at a high level, forming a bearish evening starKLine shape, while indicatorsRSILocated at a high position,StochThe indicator is at a high dead cross, facing short-term adjustments. After the adjustment, we will continue to lay out multiple orders, and pay attention to the top within the day16.9and17.2First line pressure level, follow below16.5Frontline support, intraday strategy suggested by Xiao Yufan to retrace on dips.
Suggestions for intraday silver operations: Step back16.6-16.7Go long, stop loss at0.4Points, target16.85-17USD.
crude oilMessage surface parsing:
Yesterday, oil prices benefited from news that the United States may sanction Venezuela, once again turning red,NYMEX9Monthly deliveryWTIcrude oilfuturesrise in price0.46USD or0.9%, to50.17dollar/Bucket, created a self5month24The highest closing price since the beginning of the day. The Venezuelan government held the Constituent Assembly elections over the weekend, and the Maduro government subsequently stated that it exceeded800Thousands of people voted in favor of granting the Maduro government overwhelming power to redraw the constitution. But the US government does not recognize this and is considering imposing sanctions on Venezuela's crucial oil industry. Venezuela is OPEC(OPEC)One of the member countries and also one of the main countries exporting crude oil to the United States. Sanctions against Venezuela may lead to a shortage of heavy oil supply to US refineries, as Saudi Arabia has reduced its exports to the United States. In the end, all these factors will increase speculative positions betting on rising oil prices.
However, the oil market is not entirely dominated by bullish news. According to sources, energy intelligence monitoring agenciesGenscapeAfter tracking the level of physical commodities, it was concluded that the inventory of Kuxin crude oil last Friday was5830Ten thousand barrels, although down from the previous Friday39.410000 barrels, but still up from last Tuesday8.9Ten thousand barrels. Due to the peak oil demand season, the inventory of Kuxin crude oil has significantly decreased in the past few months. Moreover, even though OPEC's reduction in production has led to a decrease in global production, the growth in US crude oil exports has resulted in substantial reserves in Gulf countries.
Technical analysis of crude oil:
Yesterday, the crude oil monthly line closed with a perfect bullish candlestick. The weekly line continued to close with a bullish trend, while the daily line stabilized despite some downward adjustments yesterday49.1After the first line, it rose again, and the daily line continued to close with a bullish line. The six consecutive bullish lines formed a bullish trend, and yesterday's daily level was at the same level55-53.4-52The resistance of the trend line has been broken through, and stepping back near the trend line is expected to further rise in the future; from4Looking at the hourly chart, yesterday broke through the previous high point49.9On the front line, the bullish trend continues and is expected to further rise in the future. From the perspective of the Bollinger Bands, the opening of the Bollinger Bands is upward, while the bullish trend remains unchanged. Currently, the price is on the upper track of the Bollinger Bands, and the indicatorRSIAt a high position, be cautious in pursuing more and continue to increase after stepping back; from1Looking at the hourly chart, the Bollinger Bands are opening upwards, while the bullish trend remains unchanged. Currently, the indicatorRSILocated at a high position,StochThe indicator has a high dead cross, with a short-term pullback, and will continue to rise after the pullback stabilizes; Follow above within the day50.4Frontline resistance level, pay attention below49.2On the front line support level, intraday strategy Xiao Yufan suggests stepping back on dips.
Suggestions for intraday crude oil operations: Fallback49.6-49.8Long, stop loss0.4Points, target50.4-50.6.Break the position to see51。
Text: Xiao Yufan Author's Innovationxyf9996 |
"Small gifts, come to Huiyi to support me"
No one has offered a reward yet. Give me some support
|


 ZFX山海证券:金价创七个月新低!
Wednesday(6month24日),现货黄金价格大幅下挫2.7%,最终报收于每盎司3998.95美元,不仅跌破
ZFX山海证券:金价创七个月新低!
Wednesday(6month24日),现货黄金价格大幅下挫2.7%,最终报收于每盎司3998.95美元,不仅跌破
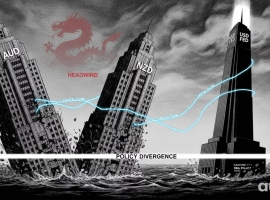 Aurra Markets:澳元兑美元走势分析
澳元与纽元为何持续走弱? 随着美元走强主导外汇市场,澳元和纽元正承受显著压力。这
Aurra Markets:澳元兑美元走势分析
澳元与纽元为何持续走弱? 随着美元走强主导外汇市场,澳元和纽元正承受显著压力。这
 Aurra Markets:美光毛利率高达 84.9
美光如何在内存危机之下逆势超越科技巨头? 美光科技(Micron Technology)近期凭借
Aurra Markets:美光毛利率高达 84.9
美光如何在内存危机之下逆势超越科技巨头? 美光科技(Micron Technology)近期凭借
 ZFX山海证券:金价退守4100USD barrier
全球黄金市场正在经历一场剧烈的调整。周二(6month22日)现货黄金价格大幅下跌1.9%,触
ZFX山海证券:金价退守4100USD barrier
全球黄金市场正在经历一场剧烈的调整。周二(6month22日)现货黄金价格大幅下跌1.9%,触
 Aurra Markets:标普 500 技术性破位
为何标普 500 和纳斯达克指数同步抛售?一轮显著的隔夜跳空下跌,使标普 500 指数与
Aurra Markets:标普 500 技术性破位
为何标普 500 和纳斯达克指数同步抛售?一轮显著的隔夜跳空下跌,使标普 500 指数与


 Riser card
 Top card
 Silence card
 Color changing card
 lifting jack