Register now, make more friends, enjoy more functions, and let you play in the community easily.
You need Sign in Can be downloaded or viewed without an account?Register Now 
x
goldIs it a gimmick or a fact that it has risen to over three thousand?
The bottoming out and rebound of the golden monthly line are inevitable, and the market has maintained a strong pattern. This is the first time in the past that the market has impacted1295When the US dollar fell, it quickly bottomed out and rebounded after a sharp sell-off, ending with a long downward trend. It should continue to confirm the bottom in the following week, but the price chose to stabilize and rise, and rose to1295The US dollar was once again hindered in the market, and the decline reached1214The US dollar, at the same time, also experienced a rapid bottoming and rebound, rising for the second time1295The US dollar, this is also a confirmation of a downward correction in the process of upward movement. It chose a one-time upward movement, causing serious oversold. The market was once again hindered by a bearish downward trend, and this month it continued to seek support downwards, with the lowest point falling to1204The US dollar has fallen below1214The US dollar has formed a process of closing after a downward staircase, quickly bottoming out and then rebounding, causing short-term passivity. The market has chosen to quickly recover, so in the absence of a price system7On the last trading day of the month, there will be a rapid upward trend followed by a hindered downward trend,8Is monthly gold going to continue to dip downwards or wait for support to rise again, and this week is crucial. If it continues to develop upwards this week, the final trend will be1204-If the range of this week's high fluctuates back and forth, and the week is hindered and falls, forming a bearish line, then8There is a high probability that the lunar shadow line will fall below again in the future1204The US dollar would constitute a three tiered development.
Analysis of Gold Technology: From the Daily Line, Below1204There were consecutive rebound signals from the bottom of the Red Cross Star and Hammer Line, but due to multiple dips, they were able to rebound, ultimately leading to a strong bullish rebound with high volume, breaking through at one point1235-45-59Up to the current high point1271Its rebound strength is also relatively strong, and it has recovered1295Most of the decline after the decline! Currently, there is a strong upward trend1258Strong resistance and1265Resistance represents whether the bulls win after a long short game. If a key position is breached, there will be a large number of buyers taking advantage of the situation to buy, which will provide upward momentum. fromKIn line, the author Su Ye can find thatKThe line has been stepping on since the support from below5The daily moving average keeps rising until it reaches1259Encountering obstacles, there was a wave of decline1243Subsequently1243Supporting strong pull to break new highs, representing1204-1259The pullback has ended and has now ushered in a new increase. The upper orbit space of Bollinger will be opened, and the upper orbit will open upwards, causing the middle orbit of Bollinger to move upwards as well,5day-10The daily moving average maintains the upward trend of the golden cross,5The daily moving average is attacking in a straight line1262Location,10Daily moving average defense1254Attached imageMACDThe red pillar can continue to increase volume,stoThe indicator runs in the overbought area, with parallel fast and slow lines, indicating that the bulls are still continuing.
Short term focus on key pressure levels and support positions, support levels1243、1248、1254、1259/60、1262、1265; Pay attention to the pressure points first1271Nearby,1271In the early stages, from1295The downward trend is a crucial support position, which has once again evolved into resistance, followed by a weak pattern in the early stage1288The physical price at the close of the high point1276Accurate resistance, later1280、1288Finally1295. Today's key support, author Su Ye suggests paying attention first1262Nearby is also the location for the first pullback test last Friday night. If it breaks today, then placing another order below will require waiting1254Above.
Overall: Gold is still bullish, and now it can be considered on the rise1260Resistance means starting from1295At the beginning, it was not a volatile downward trend, but a broad range of fluctuations, so the market is bearish in the future1170It may be difficult, but the monthly closing is now a foregone conclusion, which should be indisputable because today is the last trading day of July, and the monthly opening is open1240In the area, even if there is a sharp drop at the end of the month today, it should not arrive1240Let's talk about the monthly opening price, supported by the rise on Thursday and Friday. In theory, there is no possibility of a sharp drop. In other words, the monthly bullish cycle of oscillation is also in line with the July closing trendKLine pattern, so the last trading day at the end of the month is not optimistic about a sharp decline. According to last week's trend1243The beginning of the rise, with a significant increase in the last two days of the week, should take advantage of the trend and go long on gold at the beginning of the week!
Evening strategy: aggressive given in the morning1266reach1268Multiple orders, continue to hold them for now, look at the target1270reach1275And as previously mentioned1263The advice of taking a long position above is still valid. If it falls, it can cover the long position. If it stops, it should be placed in the1258reach1260Nearby; Additionally, above1274The resistance level in the vicinity still needs to be monitored, Su Ye suggests1274If it doesn't break, you can take a short wave in the light warehouse and look towards the target1268reach1270Nearby, stop loss1278。
crude oilMarket interpretation: The most intuitive one is the five consecutive bullish days on the daily chart, which can be said to be the biggest gain this year. On the weekly chart, it has also successfully broken through the suppression of the Bollinger Band's medium track, and the bullish trend is exceptionally fierce. What we need to pay attention to is whether this crude oil can truly stabilize above this medium track. The rise in crude oil this time can also be attributed toOPECNow it seems that Su Ye thinks we can summarize it in one sentence: Cheng YeOPECDefeat alsoOPEC. In previous articles, Su Ye mentioned thatOPECstay20At the end of the century, there was a price war with the Soviet Union. At that time, it was so crazy. In order to trip up the Soviet Union, oil prices fell repeatedly, using the so-called "hurting one thousand enemies and losing eight hundred oneself." NowadaysOPECFaced with the same pressure from the United States on shale oil and the same price war, it seems thatOPECWinning, the strengthening of the production reduction agreement has once again brought back oil prices, while Wednesday'sAPIandEIAThe significant bullish sentiment has led to continuous positive trends in recent times, causing oil prices to rise again49.8The location has been separated by nearly two months50Da Guan is once again facing the possibility of breaking through.
Last week, crude oil closed with a good bullish candlestick, forming a bullish bullish trend with a stable short-term and bullish cross. This trend may not be conducive to a decline, and crude oil is now approaching50The rapid rise of the US dollar in the short term has brought about an overbought pattern. From this perspective, it may not be appropriate for the market to move up all at once. In the past, crude oil has shifted from54The US dollar has fallen to42The US dollar has been in a downward trend throughout the entire process, and there is no problem with a bearish pattern. There has not been a decent correction in this pattern yet. From this point of view, there is a chance to achieve this in the future after being hindered and falling46-47The focus of the daily chart for the US dollar this week is on the bearish line, which is a bit high now. We suggest everyone to wait and see. There is a possibility of a pullback and a decline at any time this week. There is a high probability of a rise followed by a fall this week, and it should continue to stabilize and rise next week. It is basically certain that there will be no accidents42The low point of the US dollar will not fall below, and the trend of commodity copper is still good. The daily line is under some pressure, while the weekly and monthly lines remain bullish and unchanged. In the medium to long term, it is bullish until crude oil falls46-47Afterwards, we will lower the second best buying point and embark on a wave of our own market trend. Everyone, be prepared.
Technical analysis of crude oil:4The hourly level is currently around a stage high, starting fromKFrom an online perspective, since the last sharp rise, the market has been in a fluctuating upward trend, and its current position has not changed. The market has been closing on a spindle line, so the probability of the bullish potential gradually decreasing during this period is high, and there is a possibility of a deep correction. From the moving average perspective,30MAThe first-line support has never been touched since the rise, which means that the market is still in a strong trend, and30MAThe angle has been constantly rising, but it is affected by the deviation rate of the moving average,KLine Future Callback to30MAIt is very necessary. Although the moving average is bullish, it is important to guard against the risk of a downturn in the market. In terms of indicators, the currentKDJThe passivation state that has lasted for three trading days, thenKDJA sustained passivation at a high level above indicates that the bulls are very strong, which usually occurs in a unilateral marketKDJThe displayed result is still bullish.MACDA golden cross at a high position meansMADCIf there is also passivation, it is highly likely that the moment of another dead cross in the future will be the starting point for the bullish market. SoMACDThe conclusion drawn above is that there is a need for a correction in the market, and the future will still be dominated by bullish positions.
Overall, the bullish crude oil market is exceptionally fierce, and what needs to be paid attention to is the weekly middle track48.1In the absence of significant news at the beginning of the week, there may be a pullback in crude oil, but the decline will not be too significant. Su Ye believes that48The US dollar is a tipping point, and if it breaks again, oil prices are highly likely to continue to decline46reach47Gateway. At the beginning of the week, Su Ye suggested taking advantage of the trend and going long.
Evening strategy: fall back to49.5reach49.3Multiple nearby orders entering, target direction50USD, stop loss49Below the US dollar; If oil prices rise for the first time50.3You can empty the light warehouse once nearby, and the target is looking towards it49.7to50Near USD, stop loss50.7。
Wen/Su Ye's Discussion on Gold reform lxr1489 |
"Small gifts, come to Huiyi to support me"
No one has offered a reward yet. Give me some support
|


 ZFX山海证券:金价创七个月新低!
Wednesday(6month24日),现货黄金价格大幅下挫2.7%,最终报收于每盎司3998.95美元,不仅跌破
ZFX山海证券:金价创七个月新低!
Wednesday(6month24日),现货黄金价格大幅下挫2.7%,最终报收于每盎司3998.95美元,不仅跌破
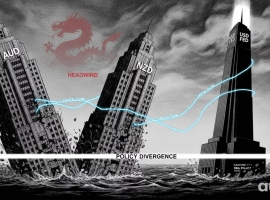 Aurra Markets:澳元兑美元走势分析
澳元与纽元为何持续走弱? 随着美元走强主导外汇市场,澳元和纽元正承受显著压力。这
Aurra Markets:澳元兑美元走势分析
澳元与纽元为何持续走弱? 随着美元走强主导外汇市场,澳元和纽元正承受显著压力。这
 Aurra Markets:美光毛利率高达 84.9
美光如何在内存危机之下逆势超越科技巨头? 美光科技(Micron Technology)近期凭借
Aurra Markets:美光毛利率高达 84.9
美光如何在内存危机之下逆势超越科技巨头? 美光科技(Micron Technology)近期凭借
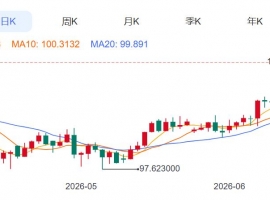 ZFX山海证券:金价退守4100USD barrier
全球黄金市场正在经历一场剧烈的调整。周二(6month22日)现货黄金价格大幅下跌1.9%,触
ZFX山海证券:金价退守4100USD barrier
全球黄金市场正在经历一场剧烈的调整。周二(6month22日)现货黄金价格大幅下跌1.9%,触
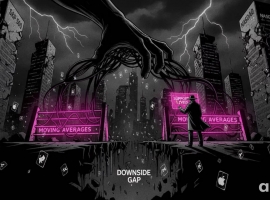 Aurra Markets:标普 500 技术性破位
为何标普 500 和纳斯达克指数同步抛售?一轮显著的隔夜跳空下跌,使标普 500 指数与
Aurra Markets:标普 500 技术性破位
为何标普 500 和纳斯达克指数同步抛售?一轮显著的隔夜跳空下跌,使标普 500 指数与


 Riser card
 Top card
 Silence card
 Color changing card
 lifting jack