"Small gifts, come to Huiyi to support me"
No one has offered a reward yet. Give me some support
| |
 Aurra Markets:【WTI Analysis of crude oil trend
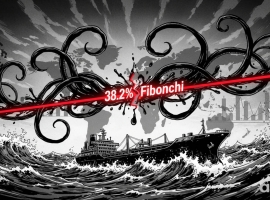
WTI原油:地缘政治引爆的突破行情? WTI原油价格已强势突破关键的 38.2% 斐波那契回
Aurra Markets:【WTI Analysis of crude oil trend
WTI原油:地缘政治引爆的突破行情? WTI原油价格已强势突破关键的 38.2% 斐波那契回
 Aurra Markets:受伊朗能源冲击,日
能源价格飙升之下,日本核心通胀为何持续走高? 在经历了 5 个月的平稳运行后,日本
Aurra Markets:受伊朗能源冲击,日
能源价格飙升之下,日本核心通胀为何持续走高? 在经历了 5 个月的平稳运行后,日本
 ZFX山海证券:金价跌至两周低位!
中东地缘局势持续动荡,国际油价持续上涨,打压美联储降息预期,美元指数走强,周四(
ZFX山海证券:金价跌至两周低位!
中东地缘局势持续动荡,国际油价持续上涨,打压美联储降息预期,美元指数走强,周四(
 ZFX山海证券:金价反弹受阻!
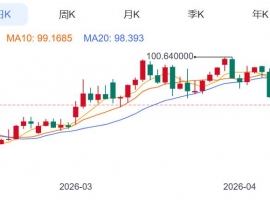
Spot Gold Wednesday(4month22日)反弹受阻。市场一度燃起乐观情绪,推动金价快速反弹至4772beautiful
ZFX山海证券:金价反弹受阻!
Spot Gold Wednesday(4month22日)反弹受阻。市场一度燃起乐观情绪,推动金价快速反弹至4772beautiful
 Aurra Markets:【黄金走势分析】空
黄金关键考验:更深层回调是否来临? Gold(XAU/USD)在经历短暂反弹后,当前再度
Aurra Markets:【黄金走势分析】空
黄金关键考验:更深层回调是否来临? Gold(XAU/USD)在经历短暂反弹后,当前再度
MIP|Mobile version|A small dark room| |Site Map |customer serviceQQ:2381682638
Copyright © 2006-2024 Huiyi Interaction https://www.forexbbs.net copyright All Rights Reserved.


 Riser card
 Top card
 Silence card
 Color changing card
 lifting jack