"Small gifts, come to Huiyi to support me"
No one has offered a reward yet. Give me some support
| |||||||||||||||||||
 原油期货是什么?一篇搞懂WTI、布兰
近年来国际油价如同云霄飞车,剧烈的波动不仅影响着你我的荷包,更吸引了全球投资者的目
原油期货是什么?一篇搞懂WTI、布兰
近年来国际油价如同云霄飞车,剧烈的波动不仅影响着你我的荷包,更吸引了全球投资者的目
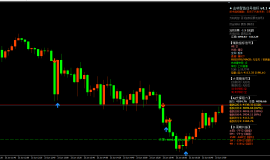
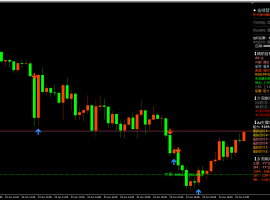 2026year6month23day Evening17:12 金价跌破41
今天这行情真是够刺激的。早上开盘金价还在4190附近晃悠,结果亚盘直接跳水,一
2026year6month23day Evening17:12 金价跌破41
今天这行情真是够刺激的。早上开盘金价还在4190附近晃悠,结果亚盘直接跳水,一
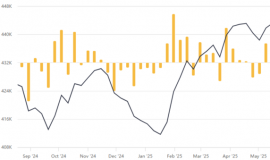
 ZFX山海证券:金价低位反弹!
Monday(6month22日),现货黄金价格上涨0.85%,最终收报每盎司4191.18美元,成功从前一交
ZFX山海证券:金价低位反弹!
Monday(6month22日),现货黄金价格上涨0.85%,最终收报每盎司4191.18美元,成功从前一交
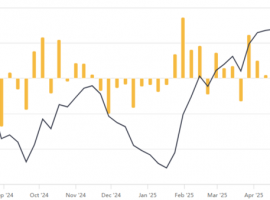
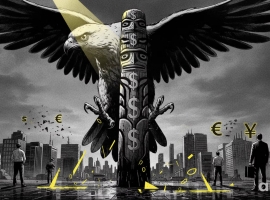 Aurra Markets:【美元走势分析】核
美元为何走强?美联储近期释放的鹰派信号,向市场传递了明确基调立场,推动美元兑主
Aurra Markets:【美元走势分析】核
美元为何走强?美联储近期释放的鹰派信号,向市场传递了明确基调立场,推动美元兑主
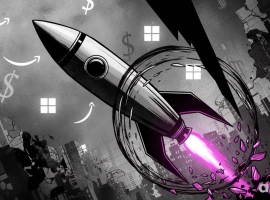 Aurra Markets:SpaceX 股价重挫 37%
是什么推动了 SpaceX 股票最近的抛售潮?在经历大规模IPO上市及强劲上涨行情后,Spa
Aurra Markets:SpaceX 股价重挫 37%
是什么推动了 SpaceX 股票最近的抛售潮?在经历大规模IPO上市及强劲上涨行情后,Spa
MIP|Mobile version|A small dark room| |Site Map |customer serviceQQ:2381682638
Copyright © 2006-2024 Huiyi Interaction https://www.forexbbs.net copyright All Rights Reserved.


 Riser card
 Top card
 Silence card
 Color changing card
 lifting jack