Register now, make more friends, enjoy more functions, and let you play in the community easily.
You need Sign in Can be downloaded or viewed without an account?Register Now 
x
Message surface parsing:
Recently, due to the impact of US economic data, the trend of the US dollar index has been weak. The movement of the Federal Reserve has always been a concern for the market. However, last week's Federal Reserve interest rate decision to maintain interest rates has once again disappointed the market with the US dollar index, causing it to fall below a new low and continue its bearish trend. Although it has been affected by6The monthly rate of durable goods orders has boosted, with the US index slightly rising. However, on Friday, in the second quarter of the USGDPThe initial annualized quarterly rate once again dealt a blow to the US dollar index, suppressing the US dollar index and providing support for precious metals such as gold prices. Based on current economic data and the impact of the September Fed rate hike, it is expected that9The probability of a monthly interest rate hike is not high, which means that the decline of the US dollar index is expected to continue.
goldTechnical analysis:
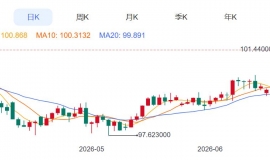
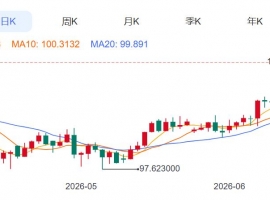
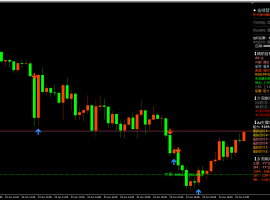
Daily line, the physical bullish line of gold prices from the previous trading day, directly breaking through the golden cross1260The bottleneck in the area means that the upward trend of gold prices in the future will continue. Therefore, in terms of consolidation, the gold price will retreat this month1200After reaching a low point on the front line, the bulls launched a general offensive, relying on the upward trend all the wayMA5andMA10The golden cross performance; from4From the hourly chart, it can be seen that the low point is rising and the high point is reaching a new high. At the same time, after reaching a new high, it retraces the previous high point and follows a perfect top to bottom conversion trend. At the same time, the price is running on the upward trend line, and the bullish trend is strong. The hourly line shows that the current performance of gold prices is still on the upper line of the Bollinger Bands. Since the strong pull up last Friday, the gold price has been maintained at1270In the high-level consolidation on the front line, currentlyMA5andMA10The performance of the golden cross is also reflected in the overall form of the golden cross, but as the consolidation cycle stops, the golden cross also appears temporarily weak. However, as shown in the attached imageMACDHowever, it is still a strong golden cross performance, so in terms of the hourly cycle, I believe that gold is still a strong bullish performance, and I will pay attention to it in the short termMA10The short-term support can be shifted to the mid track support of the Bollinger Belt. Follow above within the day1274and1280First line pressure level, follow below1265and1260On the front line support position, with a single strategy, Xiao Yufan suggests stepping back and continuing to do more.
Suggestions for intraday gold trading: Fallback1264-65Multiple, stop loss1257, Objective1276-80That's it.
Silver Technology Analysis:
Last week, Baiyin continued its counterattack momentum and quickly confirmed it since then14.30The low point bottomed out and rebounded. A wave has emerged45An angled unilateral counterattack to recapture lost territory. Return in one fell swoop16.80Neutral position. The closing of today's monthly chart will leave a very prominent lower shadow. It also shows strong bottom support, and the medium to short term will revolve around it14.30Above this level, it bottoms out and rebounds. The weekly chart shows a rebound with three positive readings. Daily chart approaching16.80A slight pause. Today, the market opened to retest resistance. If we can make a strong breakthrough and stand firm today16.80.The daily chart will accelerate the opening of upward space. If, on the contrary, it falls and closes down under pressure. In the short term, there will be some confirmation of a pullback. Enter the downward momentum and further break through the resistance. The overall trend remains bullish, but focus on the first pressure level above16.9Nearby, look at the second pressure level17.5First line. The support below is located16.5Nearby. On intraday trading, Xiao Yufan suggested falling back and continuing to go long.
Suggestions for intraday silver operations: Fallback to16.6Multiple orders entering nearby, stop loss0.4Points, target16.90, hold against the limit.
crude oilMessage surface parsing:
The trend of crude oil last week was also constantly positive, with oil prices rising step by step. Since the end of last Monday's meeting in St. Petersburg, Russia, crude oil has skyrocketed like a stimulant. Firstly, this meeting has taken action to limit Nigeria's oil production and called on some member countries to strengthen their implementation of production cuts, with the aim of helping to clear excess international crude oil inventories to support oil prices. Secondly, it isAPIas well asEIACrude oil inventories have plummeted, and oil prices are waiting for an opportunity to rise. Finally, the sustained decline of the US index has boosted oil prices. As for the trend of oil prices this week, the market has seen many headlines. Under the stimulation of various positive factors last week, oil prices have almost all ended with a physical bullish candlestick (Wednesday)EIAExcept for stimulating the market, long positions are strong enough. If this good momentum can be maintained, there will be further reasons for oil prices to rise, and the upper limit may touch50The US dollar level and even52USD.
Technical analysis of crude oil:
Oil prices saw a slight drop in the morning and opened higher, probing prices50After the US dollar hit a high level, it was slightly adjusted below. From the daily chart, there are four consecutive positive bars with the Bollinger Bands diverging upwards. The daily chart also includes four consecutive positive bars with the Bollinger Bands running upwards,KThe line runs close to the Bolin track,MA5And10MAThe golden fork is pointing upwards,MACDWith the golden cross pointing upwards, the red energy column once again showed significant increase in volume, and the bulls once again exerted their strength, starting from4When viewed online, the Bollinger Bands diverge upwards,KLine operation and below the Bollinger track,MA5And10MARun up,MACDHigh level adhesive operation, red energy column shrinkage,KDJThree line high level adhesive operation, crude oil overall still shows a bullish pattern, from1Looking at the hourly chart, the Bollinger Bands are opening upwards, while the bullish trend remains unchanged. Currently, the indicatorRSILocated at a high position,StochThe indicator has a high dead cross, with a short-term pullback. After the pullback stabilizes, it will continue to rise. Overall, it is necessary to pay attention to the above in the future50-50.5Resistance, pay attention to the area below49.2In terms of support and operation, Xiao Yufan suggests focusing on lower levels.
Suggestions for intraday crude oil operations: Callback49.5-49.7Direct multiple, stop loss0.4Points, target50.4-50.6.Break the position to see51-52。
Text: Xiao Yufan Author's Innovationxyf9996 |
"Small gifts, come to Huiyi to support me"
No one has offered a reward yet. Give me some support
|


 ZFX山海证券:金价退守4100USD barrier
全球黄金市场正在经历一场剧烈的调整。周二(6month22日)现货黄金价格大幅下跌1.9%,触
ZFX山海证券:金价退守4100USD barrier
全球黄金市场正在经历一场剧烈的调整。周二(6month22日)现货黄金价格大幅下跌1.9%,触
 Aurra Markets:标普 500 技术性破位
为何标普 500 和纳斯达克指数同步抛售?一轮显著的隔夜跳空下跌,使标普 500 指数与
Aurra Markets:标普 500 技术性破位
为何标普 500 和纳斯达克指数同步抛售?一轮显著的隔夜跳空下跌,使标普 500 指数与
 Aurra Markets:韩国 KOSPI Index plummeting
韩国股市为何遭遇最糟糕交易日之一? 韩国股市近期出现剧烈震荡,股价大幅下跌,引
Aurra Markets:韩国 KOSPI Index plummeting
韩国股市为何遭遇最糟糕交易日之一? 韩国股市近期出现剧烈震荡,股价大幅下跌,引
 原油期货是什么?一篇搞懂WTI、布兰
近年来国际油价如同云霄飞车,剧烈的波动不仅影响着你我的荷包,更吸引了全球投资者的目
原油期货是什么?一篇搞懂WTI、布兰
近年来国际油价如同云霄飞车,剧烈的波动不仅影响着你我的荷包,更吸引了全球投资者的目
 2026year6month23day Evening17:12 金价跌破41
今天这行情真是够刺激的。早上开盘金价还在4190附近晃悠,结果亚盘直接跳水,一
2026year6month23day Evening17:12 金价跌破41
今天这行情真是够刺激的。早上开盘金价还在4190附近晃悠,结果亚盘直接跳水,一


 Riser card
 Top card
 Silence card
 Color changing card
 lifting jack