Register now, make more friends, enjoy more functions, and let you play in the community easily.
You need Sign in Can be downloaded or viewed without an account?Register Now 
x
Next daygoldStabilizing and slightly falling, the lowest point in the US market during the session has reached1254.02dollar/Ounces, short-term sudden drop, gold price retreats once again1260Offline, Wednesday, Federal ReserveFOMCThe decision was made to maintain interest rates unchanged, causing gold prices to soar to a six week high. However, on Thursday, the US dollar stopped falling and rebounded. The author, Su Ye, believes that there is a trend of bottoming out and rebounding. In addition, these data released today:7month22The number of initial claims for unemployment benefits in the current week is24.4Ten thousand people, slightly higher than the previous value; United States6The monthly rate of durable goods orders has significantly increased6.5%, far higher than previous values and expectations. Thursday, the top three in the United Statesstock market indexThe opening average has reached a new record high; Both Barclays and Goldman Sachs will report the second quarter of the United StatesGDPExpected increase in growth rate, respectively from2.4%Up to2.7%; from1.9%Up to2.2%It can be seen from this that the US economy has regained its upward momentum after a brief period of softening.
Gold has recently benefited greatly from the weakness of the US dollar, coupled withfuturesShort covering in the market, where there are record breaking short positions. Based on historical experience, the normalization of positions will lead to an increase in gold prices4-5%The gold price will reach1300dollar/Ounces. The US durable goods orders and initial jobless claims data released on Thursday show that the growth of the world's largest economy is still relatively strong. But considering that the Federal Reserve considers short-term economic risks neutral, the market expects no third rate hike in the foreseeable future or this year. From the perspective of physical gold demand, China achieved net gold imports through Hong Kong's main channels in June, which increased compared to May55.80%However, gold demand will decline in the second half of the year, and a slowdown in China's growth will affect consumption. From a technical perspective, gold broke through yesterday1260Unable to stabilize after the checkpoint, but the highest price1264.99Still above yesterday's high, the upward momentum has not dissipated yet, and may rise in the short term1280The level is still possible.
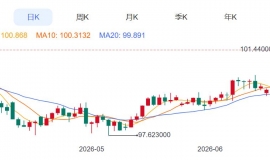
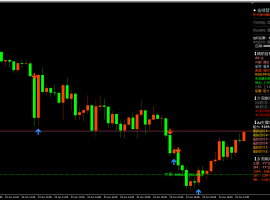
Technical analysis of gold: The trend of gold prices yesterday will definitely leave many investors with doubts. The opening of the US market also saw a strong surge of gold prices breaking through the intraday high, but then only hit the intraday high1265After the high point, the upward trend stopped, followed by a late night decline. In terms of momentum, the correction was still too strong, and the gold price directly broke through the level1260Short term support, followed by multiple explorations1255Belt support level, but this support level remains intact, ensuring the stable maintenance of gold1260Nearby, it eased and fell into a range of oscillations. Currently, gold is also operating on the middle rail line of the Bollinger Belt, andMA5andMA10The moving average is also a sticky and flat performance, and in the short term, the three track oscillation performance is observed at the hourly level.
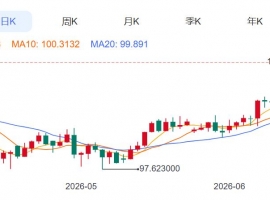
On the daily chart, gold prices are moving in the upward channel of the Bollinger Bands, with bulls still strong. The Bollinger Bands are slightly opening up, further opening up upward space. Although the overnight slight pullback caused gold prices to once again enter consolidation and ultimately recorded a small bearish cross star, the author Su Ye believes that this is the driving force for building momentum and boosting strength in the later period, and this week's high has once again refreshed to1265On the front line, then yesterday's pullback in terms of technical mentality is only a continuation of the breakthroughMA5After the moving average supports a rebound, from a trend perspective, bulls are still the main trend, and the correction of pullback in the upward momentum is also common sense. However, in the upward trend, the market is not so smooth. In the current marketMA5andMA10The strength of the golden cross remains strong, with accompanyingMACDThe attached indicator is also a manifestation of a golden cross rising, with the green energy column slowly increasing in volume.
Overall: Today, we will temporarily look at the pressure1259-60The position, followed by the pressure level, is1265What I really see is1262-63If the breakthrough situation is directly pushed up here, it will continue to rise, and another way is to leverage1259-60The pressure point of the first retreat, return to1252-50If we continue to rise within the range of, we will definitely,4The hourly moving average showed a dead cross downward trend, with prices falling and then rising again, but the range of the downward trend will not be too large. So in terms of operation, the author Su Ye still suggests using low altitude as the main approach and high altitude as a supplement.
Golden Strategy: Suggestions1259-60Empty, stop loss1265.5, Objective1252-50If broken1262.5If the withdrawal occurs, the position will be adjusted and people will leave. See below1251-52Many, stop loss points are at1245The goal is to reach a new high.
Technical analysis of silver: From the daily chart, silver rose yesterday but was hindered by the high points in the early daily chart16.88On the front line, the daily line closed with a meteor line, and the bulls and bears fell into a game period. Today, we will focus on suppressing the previous high point and the downward trend line of the previous high point line. Once we break through, we will usher in a unilateral market trend; from4Looking at the hourly chart, there is a bullish trend where the low point rises and the high point reaches a new high. Yesterday, the upward trend was hindered, and the high point closed in a bearish period. The bulls and bears are in a game period, currently operating above the upward trend line. Pay attention to whether it can stabilize in the upward trend, and it is expected to further rise in the future; from1Looking at the hourly chart, the bullish trend remains unchanged. Currently, the high level is hindered, and the bearish trend has been declining all the way. The downward momentum has slowed down, waiting to stabilize and enter the long market.
Overall, silver has a significant impact on15.2The initial upward trend was good, but now silver is rebounding16.8Last night, it fell back. This position is the resistance level of the previous downward trend line. Although it encountered resistance, it did not indicate a peak yet. However, this week's rise is from16.2-3The range is up, so the author Su Ye's analysis believes that this is support. Therefore, if there is an upward trend, it is reasonable to hold onto support and go long. We should stop guessing the top, just like gold. We don't look at the decline at the end of the week, we can just look at the volatility. If the weekly and monthly lines close well, then there will definitely be further gains next week.
Silver Strategy: Recommend a short-term decline16.5There are many light positions nearby, stop loss16.2Nearby, the target can see17Near.
crude oilFutures prices closed higher for the fourth consecutive trading day on Thursday, reaching their highest closing price in two months. The positive impact of the decline in US crude oil inventories is still fermenting. At the same time, the oil industry has recently shown a red light, with oil producing companies cutting expenses, Saudi Arabia, and othersOPECCore member countries have also expressed firm confidence in stabilizing the oil market, with US shale oil companies significantly reducing their spending budgets, and the latestAPIandEIAThe data shows a significant drop in US oil inventories, and another positive factor for oil prices may be the political stalemate between Venezuela and the United States. However, the decline in inventories is partly due to seasonal factors, and the rebound in the US dollar has partially limited the upward space for oil prices, which still raises concerns for bulls.
WednesdayAPIas well asEIACrude oil inventory data plummeted, boosting oil prices and causing them to rise. The next day, Asian oil prices remained at48.5Upward consolidation of the US dollar, although there was a slight pullback during the European session, it still held on48The US dollar level shows strong support for this position. Due to the continuous fermentation of positive news, overnight US oil prices stopped falling and rebounded, hitting a nearly eight week high49Above the US dollar, the bullish trend remains strong. Su Ye said in yesterday's article that facing oil prices50The US dollar level is just around the corner, and if we continue with this positive momentum50Da Guan is also within reach.
Technical analysis of crude oil: The daily chart continues to show a positive trend, recording4The pattern of continuous yang, with bulls rising step by step,KThe line runs along the Bolin track area,MA5Moving average up on48.5Support is formed nearby,MA10The moving average continues on47.5Forming lower support, howeverMA5/MA10The moving average may appear to deviate, but it is not particularly noticeable,MACDIndicator on0Running in the direction of the axis, the red volume can increase volume, the indicator is strong, and the overall bullish trend of the daily chart remains unchanged. Looking above50The vicinity of the checkpoint remains unchanged;4From the hourly chart, it can be seen that the Bollinger Bands index runs upwards, while the bulls remain unchanged. The Bollinger Bands track upwards49.8frontline,MA/MA10Strong upward trend of the moving average, respectively49/48.8Forming support, the Bollinger track continues to48.1Forming lower support,MACDIndicator on0Running above the axis, but the upward trend slows down, the red volume can continue to decrease, and the indicator is neutral.
Overall, oil prices have once again risen as scheduled, at the position mentioned in yesterday's trading session48.35-48.25The position is just right, which is the support position for the rapid decline before the US market, and it has also reached the stop profit point after entering the market49.15The position and overall trend are strong. However, one thing to note is that the current high oil prices are in the position of testing an upward wedge on the track, and the wedge shape is often a reversal signal, so it is important to note that49.2-49.5The breakthrough of pressure within this range still requires the support below48.5-48.4As for today's oil prices, Su Ye, like yesterday, does not agree with chasing orders and only operates after a pullback, with a focus on lower prices.
Crude oil strategy: suggest falling back to48.7Long nearby, stop loss48.3, Objective49.5; First touch above49.8-49.9Short term short orders with stop loss at50Above the US dollar, target49.4Near.
Wen/Su Ye's Discussion on Gold reform lxr1489 |
"Small gifts, come to Huiyi to support me"
No one has offered a reward yet. Give me some support
|


 ZFX山海证券:金价退守4100USD barrier
全球黄金市场正在经历一场剧烈的调整。周二(6month22日)现货黄金价格大幅下跌1.9%,触
ZFX山海证券:金价退守4100USD barrier
全球黄金市场正在经历一场剧烈的调整。周二(6month22日)现货黄金价格大幅下跌1.9%,触
 Aurra Markets:标普 500 技术性破位
为何标普 500 和纳斯达克指数同步抛售?一轮显著的隔夜跳空下跌,使标普 500 指数与
Aurra Markets:标普 500 技术性破位
为何标普 500 和纳斯达克指数同步抛售?一轮显著的隔夜跳空下跌,使标普 500 指数与
 Aurra Markets:韩国 KOSPI Index plummeting
韩国股市为何遭遇最糟糕交易日之一? 韩国股市近期出现剧烈震荡,股价大幅下跌,引
Aurra Markets:韩国 KOSPI Index plummeting
韩国股市为何遭遇最糟糕交易日之一? 韩国股市近期出现剧烈震荡,股价大幅下跌,引
 原油期货是什么?一篇搞懂WTI、布兰
近年来国际油价如同云霄飞车,剧烈的波动不仅影响着你我的荷包,更吸引了全球投资者的目
原油期货是什么?一篇搞懂WTI、布兰
近年来国际油价如同云霄飞车,剧烈的波动不仅影响着你我的荷包,更吸引了全球投资者的目
 2026year6month23day Evening17:12 金价跌破41
今天这行情真是够刺激的。早上开盘金价还在4190附近晃悠,结果亚盘直接跳水,一
2026year6month23day Evening17:12 金价跌破41
今天这行情真是够刺激的。早上开盘金价还在4190附近晃悠,结果亚盘直接跳水,一


 Riser card
 Top card
 Silence card
 Color changing card
 lifting jack