"Small gifts, come to Huiyi to support me"
No one has offered a reward yet. Give me some support
| |
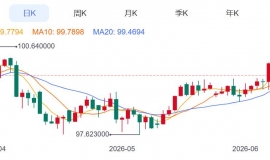
 ZFX山海证券:金价冲破4300USD!
Monday(6month15日),现货黄金连续第三个交易日强势上涨,盘中最高触及4369.07dollar/ounce
ZFX山海证券:金价冲破4300USD!
Monday(6month15日),现货黄金连续第三个交易日强势上涨,盘中最高触及4369.07dollar/ounce
 Aurra Markets:标普 500 与纳斯达克
S&P 500 与纳斯达克上涨行情:是牛市陷阱还是趋势反转? S&P 500 与纳斯达克本周
Aurra Markets:标普 500 与纳斯达克
S&P 500 与纳斯达克上涨行情:是牛市陷阱还是趋势反转? S&P 500 与纳斯达克本周
 Aurra Markets:人工智能能否引爆新
人工智能真的能带动整个市场吗? 随着人工智能(AI)热潮持续升温,越来越多投资者
Aurra Markets:人工智能能否引爆新
人工智能真的能带动整个市场吗? 随着人工智能(AI)热潮持续升温,越来越多投资者
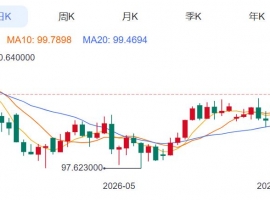
 2026year6month16日午后金价4316Near USD
今天午后盘面,现货黄金报价4316dollar/盎司附近,亚盘时段基本在4307reach4330这个区间
2026year6month16日午后金价4316Near USD
今天午后盘面,现货黄金报价4316dollar/盎司附近,亚盘时段基本在4307reach4330这个区间
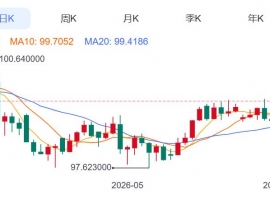 ZFX山海证券:金价上涨近100USD!
Monday(6month15日)亚市早盘,现货黄金高开高走,一度上涨2.18%to4308.91dollar/盎司,为近
ZFX山海证券:金价上涨近100USD!
Monday(6month15日)亚市早盘,现货黄金高开高走,一度上涨2.18%to4308.91dollar/盎司,为近
MIP|Mobile version|A small dark room| |Site Map |customer serviceQQ:2381682638
Copyright © 2006-2024 Huiyi Interaction https://www.forexbbs.net copyright All Rights Reserved.


 Riser card
 Top card
 Silence card
 Color changing card
 lifting jack