Register now, make more friends, enjoy more functions, and let you play in the community easily.
You need Sign in Can be downloaded or viewed without an account?Register Now 
x
goldTrend analysis:
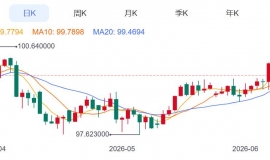
Friday(10month21day)During the Asian session, spot gold fluctuated narrowly near a three week low and is currently trading in1627Near the US dollar, the number of initial jobless claims unexpectedly decreased, indicating that the US labor market remains strong. Federal Reserve officials say that interest rates will be much higher by the end of the year4%It may be necessary to continue raising interest rates to help US bond yields continue to rise,10Annual US Treasury yield refresh2008year6The high point of the month has hindered the rebound of gold prices. Technically, there is still further downside risk for the gold price.
Gold rose first and then fell on Thursday, rising first is not the trend, closing is the key. Don't be bullish too much. It depends on the final closing position to determine the strength and weakness of the next day's continuation, which was briefly touched yesterday1645.46dollar|The ounce is at a high level, and in the late trading session, it came under pressure and turned downwards. Exhale all the intraday upward momentum and close at a low level, with a small bearish cross at the close of the daily chartKLine. As expected in yesterday's daily review, the rebound will not exceed the critical point1646.Short term bearish sentiment remains, although there was a slight rebound during the trading session, fortunately it recovered in the late trading session1640Below. It is expected to further decline today. In terms of news, last week's strong initial jobless claims data and comments from Philadelphia Federal Reserve Bank Chairman Huck sharply raised concerns about the Fed's interest rate hike and the possibility of plunging the economy into recession.
4The hour was accompanied by a wave of counter draws confirming the resistance point of the top and bottom transition, and the end of the trading session was under pressure and closed at a low level. Therefore, yesterday's rebound high point is a short-term correction resistance point, as well as a critical point for long and short positions, with a distinct sense of hierarchy or downward steps1684to1672 1667to1645The high point slowly moves downwards, and the rebound strength begins to weaken. The moving average indicator also turns downwards after rebounding first and then falling, driving the death cross. Today's short-term trend is expected to further decline. The Bollinger Bands have just hit a low point where the middle track is under pressure and has recovered, which is usually the short-term boundary between strength and weakness. Hold on and close short term bearish.1The hourly chart shows a roller coaster like rebound and rebound. Compared to yesterday's rebound and subsequent decline, it opened at a low level today and is expected to reach a new low after consolidation. Today's resistance is1636-1640.The critical point is at1645.50.
Suggestions for Gold Operations:1636-1640There is still empty defense nearby1646.50target1620-1615。
For friends who have no direction in the market or have deep losses, they can find Fang Yuan to solve the problem. Even small funds have the conditions for profitability. Large funds make big profits, small funds make small profits, and we can do it according to our abilities. As long as your trust follows me, I will definitely protect your account, and the profits will not be small. We will sail together in the storm and fight side by side to guide WeChatfysj87
crude oilMarket trend analysis;
Crude oil surged and fell back on Thursday, since84.5Shaking upwards, surging towards87On the front line, unable to continue the rise, the lowest point reached during the early morning sharp decline84.1Daily closing85On the front line, oil prices are hindered by the daily trend87On the front line, close at the middle track,87The oil price continues to decline without breaking through, fluctuating within a large range, from the four hour and hourly lines, parallel to the Bollinger Bands, and showing a short-term trend87-84Interval oscillation, watch for the day first84Can the frontline effectively support, breaking the level will lead to a decline83-82Overview of daily operational strategies above87For the watershed, first look at the interval oscillation.
【原油策略】
1,86.8-87Empty, stop loss0.4, Objective86-85.5
2Follow84Gains and losses, this position remains unbroken84.2One more time, stop loss0.4, Objective85-85.5
Note: This article is provided by Fang Yuan. I interpret world economic news, analyze global investment trends, and conduct in-depth research on commodities such as crude oil, gold, and silver. If reprinted, please indicate the source. Kind reminder, investment carries risks and caution is required when entering the market. Due to the latency of online publishing, operational suggestions are for reference only. Specific locations will be provided based on actual data. Please take risk control measures yourself.
|
"Small gifts, come to Huiyi to support me"
No one has offered a reward yet. Give me some support
|

 ZFX山海证券:黄金市场上演强势反弹
全球黄金市场再次上演强势反弹。周二(6month16日)现货黄金价格续涨0.5%, closing per ounce433
ZFX山海证券:黄金市场上演强势反弹
全球黄金市场再次上演强势反弹。周二(6month16日)现货黄金价格续涨0.5%, closing per ounce433
 2026year6month17day 上午 Spot gold4330beautiful
【行情综述】
兄弟们,上午好。盘面看,金价昨天收盘报4330.98dollar/盎司,期货端
2026year6month17day 上午 Spot gold4330beautiful
【行情综述】
兄弟们,上午好。盘面看,金价昨天收盘报4330.98dollar/盎司,期货端
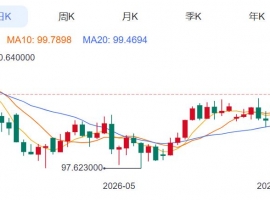 ZFX山海证券:金价冲破4300USD!
Monday(6month15日),现货黄金连续第三个交易日强势上涨,盘中最高触及4369.07dollar/ounce
ZFX山海证券:金价冲破4300USD!
Monday(6month15日),现货黄金连续第三个交易日强势上涨,盘中最高触及4369.07dollar/ounce
 Aurra Markets:标普 500 与纳斯达克
S&P 500 与纳斯达克上涨行情:是牛市陷阱还是趋势反转? S&P 500 与纳斯达克本周
Aurra Markets:标普 500 与纳斯达克
S&P 500 与纳斯达克上涨行情:是牛市陷阱还是趋势反转? S&P 500 与纳斯达克本周
 Aurra Markets:人工智能能否引爆新
人工智能真的能带动整个市场吗? 随着人工智能(AI)热潮持续升温,越来越多投资者
Aurra Markets:人工智能能否引爆新
人工智能真的能带动整个市场吗? 随着人工智能(AI)热潮持续升温,越来越多投资者


 Riser card
 Top card
 Silence card
 Color changing card
 lifting jack