Register now, make more friends, enjoy more functions, and let you play in the community easily.
You need Sign in Can be downloaded or viewed without an account?Register Now 
x
8Month,gold价格连续第五个月下跌,这是自2018年以来月线最长持续跌幅,因为美联储暗示将提升并保持借贷成本在平息通胀所需水平一段时间,即使这意味着让家庭和企业承受一些痛苦。
在至关重要的美国非农就业数据公布之前,投资者不愿大举押注黄金。此前公布的美国消费者信心数据强劲,支撑美联储9月份连续75个基点加息预期。若就业数据继续火热,可能会重振美元涨势,使黄金下跌趋势保持不变。
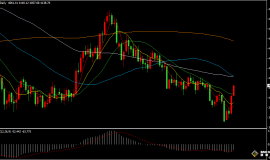
From a technical perspective, gold fell back to near its intraday low in the late night of yesterday, and the daily chart closed negative. In the morning session, it fell directly and hit its lowest point1705Nearby, pay attention to the support at this location within the day. If1705Effective support, gold will mainly fluctuate today, if it falls below the effective level1705And forced to wear it1700The integer mental barrier will continue to be examined1694even to the extent that1680Nearby. The market can only stand up again1711Only then can the downward trend be ended, otherwise the probability of breaking down is still relatively high
At the daily level, the Bollinger Bands continue to open downwards, and the price did not break through the resistance of the Bollinger Bands in last week's rebound, which means that the price will once again explore the low point. This week, the price will oscillate downwards along the Bollinger Bands, and the overall trend is weak with a clear direction.4In the early hours, the Bollinger Belt opened downwards and the price showed a stepped downward trend. In the morning, the opening price continued to decline, opening up support near the lower track and testing it1700At the first level, it is expected to break through this support within the day. In terms of operation, it is best to focus on rebounding from high altitude, with attention from above1710-1713Nearby resistance.
crude oilThe recent trend of prices is quite uncertain and the direction is not very clear. Last week's rebound broke through important resistance, but this week, due to the influence of fundamentals, prices have once again broken through90The US dollar has fallen back to near its low point. At the daily level, the Bollinger Bands are flat, causing prices to rise and fall. The consecutive two day bearish candlestick has brought prices back below the Bollinger Bands, causing them to weaken again. Currently, it is not yet time to bottom out.4At the hour, the Bollinger Bands opened downwards, and the price was sideways near the lower track. Although the US stock market surged one wave yesterday, it quickly gave up the gains, and the price trend was still slightly weak. The intraday operation was mainly focused on rebounding at high levels, while the upper focus was on the high point of yesterday's US stock market rebound, that is91.5Resistance near the US dollar.
Operation strategy:
黄金:反弹1710Short nearby, stop loss1722, Objective1680。
原油:反弹90.5Short nearby, stop loss91.7, Objective87。
|
"Small gifts, come to Huiyi to support me"
No one has offered a reward yet. Give me some support
|

 Aurra Markets:【欧元兑美元走势预
欧元兑美元强势反弹:关键阻力位面临突破还是假突破?能源价格回落及美元走软,为欧
 Aurra Markets:10 月就业报告前瞻,
10 月就业报告有何值得关注的看点?定于周五公布的 10 月就业报告备受市场关注,预
 美国中期选举结果对黄金影响巨大!SI
this morning11.5国际现货黄金延续了前一日的强势,现货黄金盘中突破4100dollar/盎司,一度触及4
 Aurra Markets:铜价面临关键抉择,
铜价是否预示全球经济格局正在转向?当前,铜价正处于关键十字路口,短期经济逆风与
 Aurra Markets:美国民主党与国会:
民主党掌控国会将如何影响您的财务状况?近期美国选举带来了美国政坛的重大变化,民






 Riser card
 Top card
 Silence card
 Color changing card
 lifting jack