Register now, make more friends, enjoy more functions, and let you play in the community easily.
You need Sign in Can be downloaded or viewed without an account?Register Now 
x
goldMarket trend analysis
Analysis of Gold Message Surface:
Monday(7month27In the short term, the US dollar index accelerated its decline and continued to hit a two-year low93.82。市场押注美联储将继续扩大宽松,而futures市场美元净空仓逼近逾两年高位。随着美元大跌且全球经济担忧提振避险需求,黄金现货、期货盘中相继创下纪录新高。今年流入黄金支持的交易所交易基金(ETF)The funds have exceeded2009Record set in the year, with total holdings exceeding3300Tons, reaching a historic high. Analysts say that gold prices will be "very easy to break through"2000The US dollar barrier. In addition, as the global pandemic continues to spread, the European Union has introduced an unprecedented stimulus plan, while the United States also plans to introduce it1A trillion dollar stimulus policy to boost economic recovery has led to further increases in gold prices. In addition, including an upgrade in geopolitics, various factors are favorable for the short-term rise of gold, with gold spot and futures hitting record highs one after another.
International Gold Technology Analysis:
Affected by the impact of the spread of the epidemic on the prospects of economic recovery in the United States, institutions have begun to flee the stock market and gradually flooded into the gold market. Recently, international concerns have intensified, which may weaken the support of US stimulus measures for the stock market. The short-term risk of the stock market reaching its peak has driven safe haven funds into gold. Given the expected increase in inflation, gold should be a large diversified investment tool for long-term investors. Overall, the upward momentum of gold prices is strong, and the fundamentals are still bullish.
Daily level: oscillating higher; Bollinger Bands with Three Tracks Upward, Gold Price Breaks Above the Upper Track, Continuously5The trading day closed higher, reaching its highest point in the previous trading day1906dollar/Ounces, continue to brush close9Annual high.MACDThe energy of the golden cross and red pillar increases,KDJThere is a trend of turning into a dead cross at high positions and the index is close90. From a technical perspective, gold prices are still optimistic and upward, but there is a need to be cautious of the risk of short-term or high-level pullbacks due to overbought gold prices.
With the significant increase in gold prices, it continues to brush up close9At an annual high, there is no significant resistance above the short-term, and even a breakthrough has been made2011year9Touched by the moon1921This will further boost previous market predictions that gold prices will be tested within the year2000Optimistic expectations for the US dollar. If there is a pullback in gold prices, it is recommended not to blindly short at high levels. Any pullback may be a good time for investors to buy. Pay attention to the upper track of the Bollinger belt for the lower support1900If it falls below the material, it will be explored in sequence5Daily moving average1860and10Daily moving average1832Near.
4Hour level:
Consolidate and then pull up; From a four hour perspective, the three tracks of the Bollinger Belt are all upward, and gold prices have reached a new historical high, currently under pressure on the upper tracks.MACDThe golden cross, but the energy of the red pillar weakens,KDJHigh preliminary dead cross, index close80Nearby. From the trend perspective, gold is still bullish, but there may be a slight pullback in the short term. On the upward side, pay attention to the Bollinger Bands on the track first1945Nearby suppression, if the material is broken and tested upwards1970. Preliminary support below13average1900Nearby, if you fall through the material, step back20average1860Nearby. Overall, in today's short-term gold trading strategy, Liang Qiandong suggests staying high and staying low. Follow Above1980-1985One line of resistance, pay attention below1905-1900Frontline support.
crude oilMarket trend analysis
Analysis of crude oil news: Monday(7month27The price of crude oil in Shanghai has fallen, and the main contractSC2009To294.8element/Bucket closing, down1.37%, setting a new low for a week. The resurgence of the global pandemic has led to a bearish demand outlook in the market, while data shows that the number of US crude oil wells has increased since3For the first time since the beginning of the month, there has been an increase, which is consistent with the increase in US crude oil production last week1010000 barrels/At the same time, the rebound in fracturing activity during the Permian period also suggests that US crude oil production will further increase. At the same time, the Brazilian national oil company also plans to increase production byOPEC+stay8At the time of monthly production increase, it has intensified the difficulty of balancing the oil market. At the same time, international tensions have intensified the pressure of economic downturn, especially as the epidemic continues to spread. Goldman Sachs analysts had predicted that global aviation fuel demand would continue until2021By the end of the year, it will still be significantly lower than2019The peak of the year will continue to be a negative impact on global energy demand.
Technical analysis of US crude oil:
The crude oil daily closed with a bearish candlestick in the middle, with the high price not breaking through before and the low price breaking through a new low, showing a downward trend. After two consecutive bullish days, oil prices fell, indicating that the bulls were not firm enough. With three steps and one turn back, the Bollinger Bands leveled to the right without any obvious signs of turning. On the long and short indicators, the bulls showed signs of weakness, but did not form a dead cross, indicating high volatility in oil prices. Crude oil in6month15Daily contact35.0After the US dollar, oil prices received support and experienced a volatile upward trend, with an overall small magnitude7month21Setting a new high every day42.48After the US dollar, it further affected the continuation of the upward trend line. If we maintain the support of the downward trend line during today's pullback, there is a high probability that there will be signs of continuation. I will pay attention to the upward pressure level42.3The resistance of the US dollar fluctuation platform will be tested after further breakdowns43.7Horizontal resistance, first focus on supporting the downward trend of oil prices40.5-40.0Position range support, further breaking will change the pattern of oil price fluctuations and rise, testing the early support39.0-39.2Horizontal support. Overall, in terms of short-term trading strategy for crude oil today, Liang Qiandong's personal suggestion is to focus on rebounding at high altitudes, supplemented by a pullback and a long position, with a focus on short-term trading above43.0-43.5Frontline resistance, short-term focus below40.0-39.5Frontline support. |
"Small gifts, come to Huiyi to support me"
No one has offered a reward yet. Give me some support
|

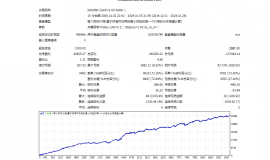
 【无敌黄金】一单一结
bookEAbyMT4平台专属现货黄金自动化交易程序,核心采用严格一单一结机制,同一时段仅持
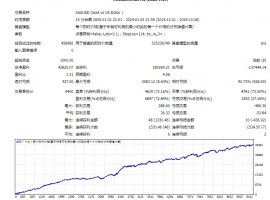
【无敌黄金】一单一结
bookEAbyMT4平台专属现货黄金自动化交易程序,核心采用严格一单一结机制,同一时段仅持
 7month10日午后黄金策略:金价回落至411
目前消息面对黄金还是偏压制。市场对美国利率继续维持高位、甚至进一步收紧的预期有
7month10日午后黄金策略:金价回落至411
目前消息面对黄金还是偏压制。市场对美国利率继续维持高位、甚至进一步收紧的预期有
 ZFX山海证券:金价惊险重返4100dollar
7month9日,国际黄金市场上演了一场惊心动魄的逆转大戏。在经历了连续三个交易日的下跌之
ZFX山海证券:金价惊险重返4100dollar
7month9日,国际黄金市场上演了一场惊心动魄的逆转大戏。在经历了连续三个交易日的下跌之
 ZFX山海证券:金价坚守4000Pass!
Wednesday(7month8日)现货黄金价格一度跌至4020美元附近,油价应声暴涨逾5%,刷新逾两周高点
ZFX山海证券:金价坚守4000Pass!
Wednesday(7month8日)现货黄金价格一度跌至4020美元附近,油价应声暴涨逾5%,刷新逾两周高点
 7month9日早上黄金策略:金价深V反弹后
昨晚黄金走了一波急跌,盘中一度逼近4020关口,随后展开深V反弹收复大部分跌幅,最
7month9日早上黄金策略:金价深V反弹后
昨晚黄金走了一波急跌,盘中一度逼近4020关口,随后展开深V反弹收复大部分跌幅,最


 Riser card
 Top card
 Silence card
 Color changing card
 lifting jack