Register now, make more friends, enjoy more functions, and let you play in the community easily.
You need Sign in Can be downloaded or viewed without an account?Register Now 
x
goldMessage surface parsing:
On the golden side, the Federal Reserve's maintenance of super loose monetary policy, as well as the US government's multiple economic stimulus bills, have injected a large amount of funds into the market, causing the US dollar to weaken all the way and supporting the strength of gold prices. This week, it will also be announced that the United StatesGDPThe data, Federal Reserve resolutions, and progress of the US economic stimulus plan suggest that the super loose policy is expected to continue, which is beneficial for gold prices.
The recent competition between the world's two largest economies in multiple fields has led to a continuous escalation of the international trade situation and geopolitical friction, and this tense relationship is likely to last for a longer period of time. Gold is favored by global capital due to its functions such as hedging and appreciation, which has supported the price of gold. The COVID-19 has not been effectively controlled, and the confirmed cases of COVID-19 worldwide exceed1600Million cases. Before the COVID-19 is effectively controlled, the global economy is under great pressure, and the global easing tone will remain, which is good for gold bulls.
International Gold Technology Analysis:
Gold has reached a new historical high and reached its highest point1965Position, strong bullish trend extension, from2015Of1046So far1945The golden bull market has already started running900The space in US dollars. However, the grand market trend is still in its infancy and shows no signs of ending. The continuous positive pattern of monthly, weekly, and daily lines indicates the current extremely strong state. But in the same bull market, there will also be a pullback trend, with the closest rise1670So far1945Running265In terms of USD space, Qian Dong believes that once there is a deep pullback action after the market accelerates to reach its peak, it will face a peak market. But before there is a deep pullback, the stage of accelerating to the top is not empty.
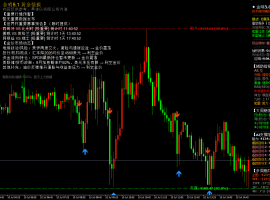
Looking at the golden daily chart:
Gold broke through in early trading1920Year and1940The two main checkpoints of the year have broken through historical highs.MACDThe golden cross red kinetic energy column gradually expands,KDJThe golden cross random indicator continues to trade within the overbought level, indicating that gold is expected to continue to rise or consolidate at high levels. Gold is stable in1800After the integer level, the bulls continue to strengthen their strength. Liang Qiandong believes that due to the fact that gold remained in the1900Line, prices have further increased this week. Within a few hours after the opening, it rose by nearly40US dollars. The current moving average is still in a long-term upward trend. Continue to followMA5Moving Average1900The supporting effect.
Looking at the Golden Four Hours:
Gold surged wildly, and the bulls were unstoppable, rushing to1965The historical high of the US dollar.MACDThe golden cross red kinetic energy column has once again expanded,KDJThe golden cross random indicator touched the overbought level, indicating that the bullish momentum of gold has once again strengthened. For current gold, technical analysis is not of great significance, while position management is more artistic. A strong upward trend and scientific position management are prerequisites for ensuring profitability, as any current point entering the market will ultimately provide you with opportunities to make a profit. Overall, in terms of gold's trading strategy today, Liang Qiandong's personal suggestion is to focus on a pullback and take a long position, supplemented by a rebound at high altitudes, with a short-term focus above1980-1985Frontline resistance, short-term focus below1930-1925Frontline support.
crude oilMessage surface parsing:
For crude oil, the COVID-19 epidemic in the United States, Brazil, India and other countries still shows a record growth. The latest data shows that the confirmed cases of COVID-19 epidemic in the world exceed1600Ten thousand cases, the spread of the epidemic will still suppress the demand for crude oil. The number of crude oil wells drilled in the United States is continuous11After a weekly decline, there has been a rebound. The latest data shows that the number of crude oil wells drilled in the United States has recorded181Mouth, relative to last week's180Increased mouth1Mouth suggests the possibility of an increase in US crude oil production or reserves in the short term, putting pressure on oil prices. Since the COVID-19, the United States and Europe have implemented super loose monetary and fiscal policies for a long time. At present, the epidemic situation in Europe is better controlled than that in the United States. The economic gap between the Eurozone and the United States is gradually narrowing, and the dollar continues to weaken, boosting oil prices.
The sustained loose monetary and fiscal policies have led to a gradual economic recovery. Last Friday(7month24day)The release of manufacturing data from regions such as the United States, Eurozone, Germany, and France has seen a full recovery and a return above the boom bust line, indicating that global manufacturing is gradually recovering, boosting crude oil demand and supporting an upward trend in oil prices.
Technical analysis of US crude oil:
The overall trend of crude oil last week was a back and forth Tai Chi trend, with the weekly chart continuing to show a high crossKReporting and daily support40The pass presents an interaction of yin and yang, with the highest penetration during the week42.5The first line is under pressure and falls back, and the lower part is stepped down and explored3The daily moving average has stabilized and rebounded strongly. Due to the fact that the indicator has not fully turned upwards after the bottom rebounded, the weekly chart is in a neutral position and is expected to fluctuate and accumulate momentum. The daily chart continues with a star chartKLine consolidation, after breaking through the interval and returning to interval consolidation, Bollinger Road is tightly closing, and it is still expected to fluctuate narrowly within the interval at the beginning of this week. Qian Dong believes that from a technical perspective40The support signal near the checkpoint is obvious, and there has been no effective breakthrough in both short and long periods. However, at present, the daily level major cycle is still in a fluctuating upward rhythm, with the moving average sticking high and paying attention below the short term40.3Regional support strength, this position is in the early stage4Hourly neck line support area, while touching within the day42.3-42.If there is a clear pressure signal in the region, it is possible to intervene in short positions and see the volatility fall back. The key is to continue the high volatility pattern in the short term, with a focus on the volatility of the day. Overall, in terms of crude oil operations today, Liang Qiandong's personal suggestion is to focus on rebounding at high altitudes, supplemented by rebounding at high altitudes, with a short-term focus above42.5-43.0Frontline resistance, short-term focus below40.0-39.5Frontline support |
"Small gifts, come to Huiyi to support me"
No one has offered a reward yet. Give me some support
|

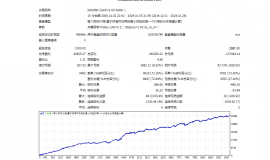
 【无敌黄金】一单一结
bookEAbyMT4平台专属现货黄金自动化交易程序,核心采用严格一单一结机制,同一时段仅持
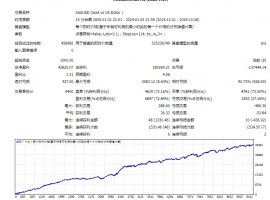
【无敌黄金】一单一结
bookEAbyMT4平台专属现货黄金自动化交易程序,核心采用严格一单一结机制,同一时段仅持
 7month10日午后黄金策略:金价回落至411
目前消息面对黄金还是偏压制。市场对美国利率继续维持高位、甚至进一步收紧的预期有
7month10日午后黄金策略:金价回落至411
目前消息面对黄金还是偏压制。市场对美国利率继续维持高位、甚至进一步收紧的预期有
 ZFX山海证券:金价惊险重返4100dollar
7month9日,国际黄金市场上演了一场惊心动魄的逆转大戏。在经历了连续三个交易日的下跌之
ZFX山海证券:金价惊险重返4100dollar
7month9日,国际黄金市场上演了一场惊心动魄的逆转大戏。在经历了连续三个交易日的下跌之
 ZFX山海证券:金价坚守4000Pass!
Wednesday(7month8日)现货黄金价格一度跌至4020美元附近,油价应声暴涨逾5%,刷新逾两周高点
ZFX山海证券:金价坚守4000Pass!
Wednesday(7month8日)现货黄金价格一度跌至4020美元附近,油价应声暴涨逾5%,刷新逾两周高点
 7month9日早上黄金策略:金价深V反弹后
昨晚黄金走了一波急跌,盘中一度逼近4020关口,随后展开深V反弹收复大部分跌幅,最
7month9日早上黄金策略:金价深V反弹后
昨晚黄金走了一波急跌,盘中一度逼近4020关口,随后展开深V反弹收复大部分跌幅,最


 Riser card
 Top card
 Silence card
 Color changing card
 lifting jack