"Small gifts, come to Huiyi to support me"
No one has offered a reward yet. Give me some support
| |
 Aurra Markets:道指与纳指分化,CPI
为何道指上涨而纳斯达克指数下跌?美股市场在本交易日呈现明显分化走势:以工业板块
Aurra Markets:道指与纳指分化,CPI
为何道指上涨而纳斯达克指数下跌?美股市场在本交易日呈现明显分化走势:以工业板块
 Aurra Markets:苹果股价下跌 6.2%:
苹果能否挺过 Mac and iPad 涨价的冲击?苹果近期上调 Mac And iPad 产品价格的决定,
Aurra Markets:苹果股价下跌 6.2%:
苹果能否挺过 Mac and iPad 涨价的冲击?苹果近期上调 Mac And iPad 产品价格的决定,
 ZFX山海证券:金价重返4000USD!
Spot Gold Thursday(6month25日)震荡反弹反转,收复4000美元重要心理关口。这一反弹并非偶然
ZFX山海证券:金价重返4000USD!
Spot Gold Thursday(6month25日)震荡反弹反转,收复4000美元重要心理关口。这一反弹并非偶然
 ZFX山海证券:金价创七个月新低!
Wednesday(6month24日),现货黄金价格大幅下挫2.7%,最终报收于每盎司3998.95美元,不仅跌破
ZFX山海证券:金价创七个月新低!
Wednesday(6month24日),现货黄金价格大幅下挫2.7%,最终报收于每盎司3998.95美元,不仅跌破
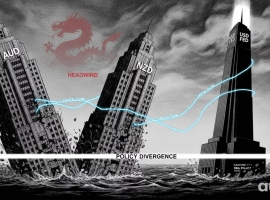 Aurra Markets:澳元兑美元走势分析
澳元与纽元为何持续走弱? 随着美元走强主导外汇市场,澳元和纽元正承受显著压力。这
Aurra Markets:澳元兑美元走势分析
澳元与纽元为何持续走弱? 随着美元走强主导外汇市场,澳元和纽元正承受显著压力。这
MIP|Mobile version|A small dark room| |Site Map |customer serviceQQ:2381682638
Copyright © 2006-2024 Huiyi Interaction https://www.forexbbs.net copyright All Rights Reserved.


 Riser card
 Top card
 Silence card
 Color changing card
 lifting jack