Register now, make more friends, enjoy more functions, and let you play in the community easily.
You need Sign in Can be downloaded or viewed without an account?Register Now 
x
Message surface parsing:
对于本周而言,欧元区的消息将成为接下来gold走势的关键,尤其是欧洲央行行长德拉基的讲话。众所周知,欧洲央行和德拉基在以往,对黄金几乎是构成打压的,而且自上周加拿大进行了近七年来首次加息之后,足以说明全球央行正在逐步退出宽松,这对于目前处于涨势中的黄金来说,并不是一件有利的事。虽然,本周欧洲央行利率决议很大概率不会宣布加息,但在全球央行有退出宽松市场的意向前提下,我们还是不得不防欧洲央行行长德拉基会发表较为鹰派的言论,一旦德拉基鹰语明显,那么黄金在本周的涨势或将打破,不排除承压回落1220附近的可能;反之,如果德拉基的言论偏于鸽派,则会看到黄金进一步的涨势。
Gold Technology Analysis:
黄金从日线图来看,下降趋势线已经被突破,同时打破压制下行的10Moving average,10The moving average will support the upward trend of gold prices in the future, and from the bottom1204Since the support of the front line, the bullish line of gold has been rising all the way, and at the same time, the bullish line has been constantly changing. The bullish force continues to strengthen, and it is expected to further rise in the future. Focus on the bullish line in the upper part of the day1240Strong pressure level on the front line, as this is the early consolidation stage2The bottom of the weekly range is also a historically trading intensive area, and it will experience a slight decline when touched for the first time.
From4From the hourly chart, the low point is rising, the high point is reaching a new high, and it suppresses the downward trend line of previous price declines10The moving averages have been broken, and prices have started to decline after being blocked on the upper line of the Bollinger Bands. Currently, they are supported by the middle line of the Bollinger Bands and are operating near the middle line of the Bollinger Bands. Subsequently, under the influence of evening data, they directly break through the suppression of the upper line of the Bollinger Bands and are operating near the upper line of the Bollinger Bands,MA5Daily moving average turning upwards with strong upward crossing10日均线形成金叉向上运行,附图指标上快慢线金叉向上运行,红色动能柱放量再次放量。
小时图上,布林带朝上呈现张口扩大之势,MA5The daily moving average is once again at1230Wearing on the front line10日均线形成金叉向上运行。价格突破布林带上轨一线运行在上轨上方,附图指标上快慢线粘合,绿色动能柱缩减,那么目前黄金多头再一次爆发,继续关注上方1235一线的压力。综合分析:肖宇梵认为黄金短期将会回调,下降力度明显减缓,可以在1230Multiple entry options are being considered nearby, please keep an eye on them within the day1240First line pressure level, follow below1225On the front line support level, it is recommended to make a pullback and go long in operation.
Suggestions for Gold Operations:
1、建议黄金1230附近多单进场,默认止损,目标看向1238-1240;
2First contact1240若未直接突破,可考虑短空一波,快进快出。
Analysis of silver trend:
跟黄金相似,白银周五借助数据影响大幅反弹,从月线来看紫诚老师认为目前处于区间震荡,重视月线的收线,一旦月线收探底的锤子线,同时价格运行在15.7上方,将会继续反弹;紫诚从周线来看,周线收阳,这也是自15.7The first bullish line since a continuous decline, with two bottoms and a closing bullish. Currently, from the daily chart, it appears that the daily line has hit multiple bottoms since a consecutive bearish downward trend last week. Silver attaches great importance this week16.2Resistance, if not broken down, is likely to rebound!
Silver operation suggestion: Callback15.8-16.0Multiple orders nearby, stop loss15.5, Objective16.2, hold against the limit.
crude oilMessage surface parsing:
美国原油上周五(7month14日)震荡反弹,创逾一周新高46.72dollar/Barrel, USA in the past two weeksEIAThe significant decrease in crude oil inventories has to some extent boosted oil prices, but the rebound in oil prices is expected to be mainly due to short positions40Continued liquidation and profit settlement above the US dollar level;6Monthly Global andOPECCrude oil production is increasing instead of decreasing, and US production is also continuing to increase, which is expected to push US oil to break through50Create obstacles. US Energy Information Agency(EIA)The data released during Wednesday's European session showed that the decline in US crude oil inventories exceeded expectations, providing some support for recent oil prices; however6Monthly Global andOPECIncreased crude oil supplyOPECThe fulfillment rate has decreased to6A new low of six months has cast a shadow over the rebound of the oil market.
Technical analysis of crude oil:
原油从日线上看,布林带开口向上收缩,KThere is a trend of upward movement between the line operation and the upper part of the Bollinger Bands, and there is a bonding trend between various moving averages,MACDThere is a secondary divergence trend in the opening of the fast and slow lines, with an increase in the red energy bar and a strengthening of the bullish trend;4On the hourly chart, the Bollinger Bands open upwards, and prices run along the upper and middle tracks of the Bollinger Bands,MA5The daily moving average crosses upwards10日均线形成金叉向上运行目前有所拐头,目前来看布林带中轨一线的支撑还是比较充足的,附图指标上快慢线粘合运行,红色动能柱缩减;小时图上,小时图上,布林带呈现张口扩大之势,由于美盘上市价格的下跌目前KThe line runs near the lower track of the Bollinger Belt,MA5Strong downward trend of daily moving average10日均线形成死叉向下运行,附图指标上快慢线死叉下行,绿色动能柱放量明显;综合来看,肖宇梵认为目前原油短线上出现回落的迹象,继续关注上方47The suppression of the US dollar on the front line and below46.20as well as46The support of the US dollar is on the front line, and it is recommended to fall back and go long in operation.
Suggestions for crude oil operation:
1.46.65-46.80First line non breaking orders enter the market, stop loss0.4US dollars, look at the target46-45.80;
2.45.70-46.0附近激进多单进场,止损0.4US dollars, look at the target46.20-46.40上方,破位持有;
3.steady45.6Nearby, stop loss0.4点,目标不变。
Text: Xiao Yufan Author's Innovationxyf9996 |
"Small gifts, come to Huiyi to support me"
No one has offered a reward yet. Give me some support
|


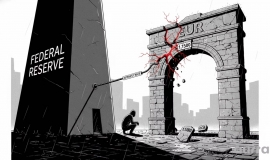
 Aurra Markets:欧元兑美元跌破 1.15
欧元兑美元为何大幅下挫?在美国联邦储备委员会最新政策声明发布之后,欧元兑美元(
Aurra Markets:欧元兑美元跌破 1.15
欧元兑美元为何大幅下挫?在美国联邦储备委员会最新政策声明发布之后,欧元兑美元(
 Aurra Markets:伊朗协议审视升温:
伊朗协议将如何影响亚太市场情绪?随着市场持续关注伊朗核协议相关谈判进展,亚太市
Aurra Markets:伊朗协议审视升温:
伊朗协议将如何影响亚太市场情绪?随着市场持续关注伊朗核协议相关谈判进展,亚太市
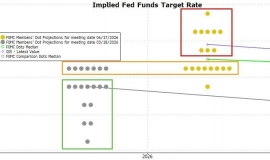
 ZFX山海证券:沃什首秀定调,美联储
local time6month17日,新任美联储主席凯文·沃什主持了上任以来的首次政策新闻发布会。利
ZFX山海证券:沃什首秀定调,美联储
local time6month17日,新任美联储主席凯文·沃什主持了上任以来的首次政策新闻发布会。利
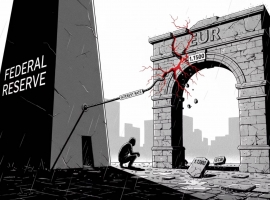
 Aurra Markets:【黄金走势展望】金
美联储采取鹰派立场后,黄金涨势是否已告终? 在美国联邦储备委员会公布鹰派货币政
Aurra Markets:【黄金走势展望】金
美联储采取鹰派立场后,黄金涨势是否已告终? 在美国联邦储备委员会公布鹰派货币政
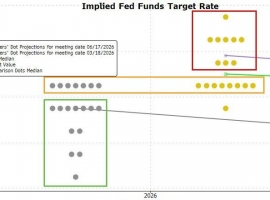
 Aurra Markets:沃什首秀掌舵美联储
凯文·沃什担任美联储主席后的首次会议释放了哪些关键信号?新任美联储主席凯文·沃
Aurra Markets:沃什首秀掌舵美联储
凯文·沃什担任美联储主席后的首次会议释放了哪些关键信号?新任美联储主席凯文·沃


 Riser card
 Top card
 Silence card
 Color changing card
 lifting jack