Register now, make more friends, enjoy more functions, and let you play in the community easily.
You need Sign in Can be downloaded or viewed without an account?Register Now 
x
Attitude determines hardship and joy, concept determines success and failure, and the simpler a person is, the more peaceful their trading becomes. Many times, you would rather be killed in battle against the tide than reflect on yourself. A drop of ink can stain a glass of water, but it is difficult to muddy a river because a generous heart can accommodate it;One sentence can ruin a temporary mood, but it is difficult to determine a person's life, because fate is in one's own hands;An accident can make your footsteps heavy and difficult to erode your persistent pursuit, because you are "alive" in the market, and because you are strong, the road is ahead. Don't easily stop walking.
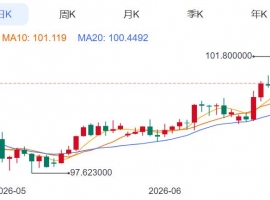
| First of all, let's review the overall trend of natural gas during this period. The daily level of natural gas prices has been three consecutive positive trends, and the overall trend is upward. From the overall trend, the bullish trend is dominant. Below is the trendMA20One line support on the moving average, hindered byMA40Frontline suppression. The overall bearish trend of natural gas shows signs of anti positivity and has been open high for three consecutive sessions. Online viewing of hoursMACDA trend that is about to intersect, green energy column bearish trading volume,KDJThe upward diffusion of the third line is another bullish trend. From the four hour line,MACDThe golden fork is pointing upwards, but the red energy column bulls are starting to collect. Overall, although the current trend of natural gas is a bearish trend, it is a small level of negative. Therefore, Minghui suggests that the main approach is to make a pullback long, supplemented by a rebound short. Please contact me for specific operations and provide online real market information. |
| 1Suggest falling back to3.040Multiple orders entering nearby, stop loss0.030USD, target3.100 |
| 2Suggest not to break above3.090Light warehouse entry and exit, stop loss zone0.030US dollars, look at the target3.040Frontline support |
| On the daily chart, there is a pattern of four consecutive positive trends, and the downward trajectory of Bollinger is no longer continuous, but there is a trend of stabilizing with a hook. The oil price has now broken through43.7The resistance has stabilized, and the future market will continue to see the Bollinger track45.7as well asMA30average47Near the checkpoint,4From the hourly chart, it can be seen that the oil price is currently hindered near the Bollinger trackMA55The moving average continues on44The checkpoint was suppressed,MA5/MA10The main reason for the moving average to continue to rise is43.3Support is formed nearby, and the track in the forest is43.1Form the second support. Overallcrude oilAt present, it has stabilized, so a pullback in the future is an opportunity to go long. In terms of goals45.7-47In terms of operation, it is recommended to recall to43.8Nearby, light warehouses can be arranged with multiple orders for a small central line |
| Suggestions for crude oil operation: |
| 1Suggest using44.9-45.1Consider short selling and stop losing near the US dollar0.3Points, target44.5-43.8Near the US dollar; |
| 2Suggest using43.5-43.7Consider going long near the US dollar and stopping losses0.3Points, target44.2-44.9Around the US dollar. |
| Silver: This round of silver boosting16.3Forming a rebound without breaking16.0The adjustment of the low point before is considered to be the right way to go. The weekly chart has been consistently negative for three consecutive days, and last week it closed with a long shadow cross star. The weekly chart level is still biased towards the sky. At the daily level, this week's trend determines whether it will rebound from the bottom or reverse from the bottom. Not much fluctuation in the morning market, synchronized with the European marketgoldThe big dive is currently showing a slanted air trend. In terms of operation, it is recommended to perform interval operations. Focus on the following16.50Support on the front line, above17.00A line of resistance. |
| Suggestion for Silver Operation: |
| 1Suggest using16.90-16.95Consider short selling and stop losing near the US dollar0.03Points, target16.85-16.70Near the US dollar; |
| 2Suggest using16.60-16.65Consider going long near the US dollar and stopping losses0.03Points, target16.85-16.95Around the US dollar. |
| The opening of the Bollinger Belt has leveled off, and the price has returned to the lower track line of the Bollinger Belt. Due to the current rise, it has successfully broken through the middle track suppression line of the Bollinger Belt and operated near the middle track,MA5The daily moving average is turning upwards and currently there is an upward trend10There are signs of daily moving averages, with both fast and slow lines showing a dead cross downward trend. However, there are currently signs of turning points, and the green kinetic energy column is decreasing in volume; On the hourly chart, the Bollinger Belt opens upwards, and the price is currently running between the upper and middle tracks after breaking through the Bollinger Belt's upper and lower tracks,MA5The daily moving average turns downward, and the fast and slow lines on the indicator double line cross upwards, with a decrease in the volume of the red kinetic energy column; So, considering the current trend, there is still a risk of an upward trend in the short term of gold. Pay attention to1254On the front line, maintain the operation within the interval1245-1254High selling and low slag are sufficient |
| gold1254Empty, stop loss1259, Objective1242-1240; |
| gold1260Full position empty, stop loss1264, Objective15-20dollar |
| writing | Minghuipin Jinwei hh656520 |
|
"Small gifts, come to Huiyi to support me"
No one has offered a reward yet. Give me some support
|

 ZFX山海证券:金价坚守4000Pass!
Wednesday(7month8日)现货黄金价格一度跌至4020美元附近,油价应声暴涨逾5%,刷新逾两周高点
ZFX山海证券:金价坚守4000Pass!
Wednesday(7month8日)现货黄金价格一度跌至4020美元附近,油价应声暴涨逾5%,刷新逾两周高点
 7month9日早上黄金策略:金价深V反弹后
昨晚黄金走了一波急跌,盘中一度逼近4020关口,随后展开深V反弹收复大部分跌幅,最
7month9日早上黄金策略:金价深V反弹后
昨晚黄金走了一波急跌,盘中一度逼近4020关口,随后展开深V反弹收复大部分跌幅,最
 ZFX山海证券:金价被油价大涨压制!
Tuesday(7month7日),油价大幅飙升,现货黄金当日下跌1.42%, receive reports per ounce4105美元,盘中一
ZFX山海证券:金价被油价大涨压制!
Tuesday(7month7日),油价大幅飙升,现货黄金当日下跌1.42%, receive reports per ounce4105美元,盘中一
 ZFX山海证券:金价反弹受阻!
Monday(7month6日),现货黄金盘初一度冲至每盎司4202.09The US dollar, created by6month22日以来的两周新
ZFX山海证券:金价反弹受阻!
Monday(7month6日),现货黄金盘初一度冲至每盎司4202.09The US dollar, created by6month22日以来的两周新
 Aurra Markets:【美元走势分析】美
疲软就业报告将如何重塑市场格局?最新美国就业报告释放出劳动力市场降温信号,推动
Aurra Markets:【美元走势分析】美
疲软就业报告将如何重塑市场格局?最新美国就业报告释放出劳动力市场降温信号,推动


 Riser card
 Top card
 Silence card
 Color changing card
 lifting jack