Post a new post
Open the left side

罗寒烟:3.16技术面基础知识

[Copy Link]
165 0

Register now, make more friends, enjoy more functions, and let you play in the community easily.

You need Sign in Can be downloaded or viewed without an account?Register Now WeChat login

x
    1Average line
    如果您相信技术分析中“趋势是您的朋友”的信条,那么移动平均线将使您获益匪浅。移动平均线显示了在特定周期内某一特定时间的平均价格。它们被称作“移动”,因为它们依照同一时间度量,且反映了最新平均线。
One of the shortcomings of moving averages is that they lag behind the market and therefore may not necessarily serve as a sign of trend change. To address this issue, use5or10The shorter period moving average of days will be lower than40or200The moving average of the day better reflects recent price trends. Alternatively, the moving average can also be used by combining two different time span averages. Regardless of use5and20The moving average of the day, or40and200天的移动平均线,买入信号通常在较短期平均线向上穿过较长期平均线时被查觉。与此相反,卖出信号会在较短期平均线向下穿过较长周期平均线时被提示。
  2、支撑和阻力
Support and resistance levels are the points in the chart that experience sustained upward or downward pressure. The support level is usually the lowest point in all chart modes (hourly, weekly, or annual), while the resistance level is the highest point (peak) in the chart. When these points show a recurring trend, they are identified as support and resistance. purchase/The best time to sell is on unbreakable support/Near the resistance level. Once these levels are broken, they tend to become reverse obstacles. Therefore, in an upward market, the broken resistance level may become a support for the upward trend; However, in a declining market, once the support level is broken, it will transform into resistance.
  3、线条和通道
  趋势线在识别市场趋势方向方面是简单而实用的工具。向上直线由至少两个连继低点相连接而成。很自然,第二点必须高于第一点。直线的延伸帮助判断市场将沿以运动的路径。向上趋势是一种用于识别支持线/水准的具体方法。反而言之,向下线条是通过连接两点或更多点绘成。交易线条的易变性在一定程度上与连接点的数量有关。然而值得一提的是,各个点不必靠得过近。通道被定义为与相应向下趋势线平行的向上趋势线。两条线可表示价格向上、向下或者水平的走廊。支持趋势线连接点的通道的常见属性应位于其反向线条的两连接点之间。
  4、发现趋势  
The first thing you may hear about technical analysis is the following maxim: 'Trends are your friends'. Finding the dominant trend will help you take a holistic view of the market direction and give you sharper insights - especially when shorter term market fluctuations disrupt the overall market. Weekly and monthly chart analysis is most suitable for identifying longer-term trends. Once you discover the overall trend, you can choose the trend within the time span you want to trade. In this way, you can buy down in an upward trend and sell up in a downward trend.
友情提示:良好的心态+过硬的技术=丰厚的市场回报!
"Small gifts, come to Huiyi to support me"
No one has offered a reward yet. Give me some support
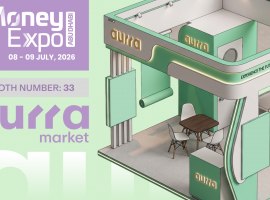
comiis_nologin
You need to log in before you can reply Sign in | Register Now WeChat login

Point rules of this version

more

Customer Service Center

238-168-2638 QQcustomer service Monday to Friday 20:00-24:00
Quick reply Back to top Back to list