Register now, make more friends, enjoy more functions, and let you play in the community easily.
You need Sign in Can be downloaded or viewed without an account?Register Now 
x
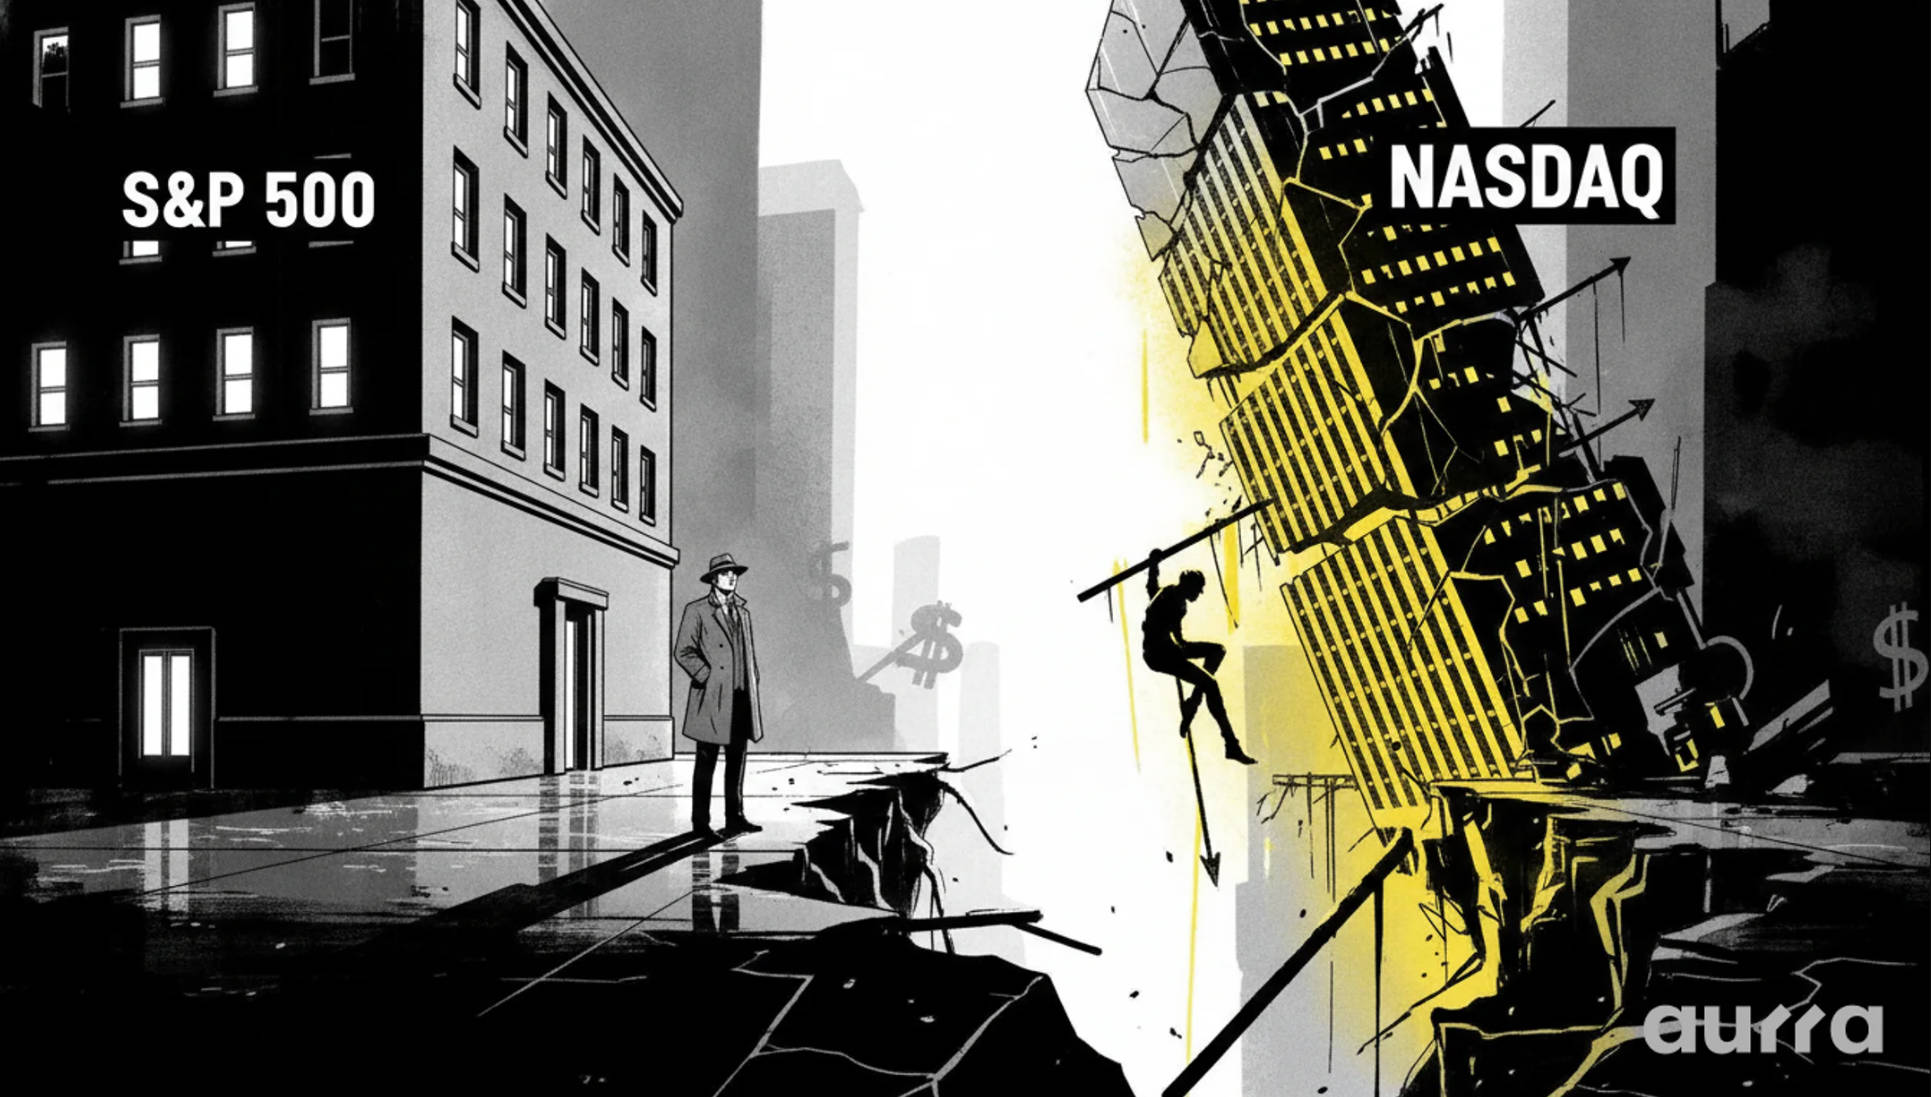
S&P 500 Why is the Nasdaq index under pressure and difficult to move despite the steady progress of the index? Major USstock market indexIt is showing a significant trend of differentiation. Covering a wider range of S&P 500 The index has gradually stabilized and entered a neutral stage; The Nasdaq index, dominated by technology stocks, remains weak on a technical level and leans towards a downward trend. This' dual market heavy personality 'reflects that funds are quietly undergoing sector rotation, which is an important warning signal that cannot be ignored for traders.
Interpreting the 'dual personality' of the market On the surface, the US stock market generally rebounded after a sharp decline last week; However, upon in-depth technical analysis, a completely different picture will be revealed. S&P 500 The signal released by Nasdaq is completely different, reflecting investors' divergent judgments on risk appetite and market prospects. This divergence usually means that the market is in an uncertain period, and funds are more inclined to reallocate assets rather than fully betting on a single direction.
S&P 500 The neutral range of the index S&P 500 The index has successfully resolved the short-term bearish pressure and entered the equilibrium stage of the game between buyers and sellers. Its resilience stems from the diversity of its components. This index covers a wide range of sectors of the US economy, including finance, healthcare, and industry. This structure shields it to some extent from the impact of concentration risks in the technology industry, making it easier to achieve stability.
Why is the Nasdaq index still under pressure Compared to S&P500In sharp contrast, the bearish trend of the Nasdaq index remains unchanged. The index is highly concentrated in a few large technology and growth stocks, which are highly sensitive to changes in long-term interest rate expectations. As the market begins to take into account the possibility of the Federal Reserve raising interest rates within the year, the fundamental factors supporting the high valuations of these tech giants are weakening, and bears continue to dominate relatively.
Invisible power: Plate rotation is taking place S&P 500 The divergence between the index and the Nasdaq index is likely a classic case of sector rotation. The so-called sector rotation refers to investors strategically transferring capital from one industry sector to another based on their anticipation of the next stage of the economic cycle. This is not a panic selling, but a carefully considered risk reallocation.
Transitioning from growth stocks to value stocks? The current market dynamics suggest that funds are potentially flowing from "growth stocks" - the tech focused Nasdaq index - to "value stocks" - the S&P 500 The more traditional and robust companies in the index and Dow Jones index. When economic uncertainty rises, investors often reduce their allocation to high beta growth stocks, as these assets are typically seen as higher risk and instead buy stocks of companies with more stable profits and relatively lower valuations. This defensive posture is a direct response to the current geopolitical and economic headwinds.
The impact of yield on the valuation of technology stocks To understand why technology stocks are hit the hardest, the key is to grasp a core valuation principle: rising interest rates will lower the present value of future earnings, which is particularly detrimental to growth stocks that promise substantial profits in the future. As bond yields rise, the "discount rate" used in these valuation models also increases, causing a decrease in the current value of forward cash flows and putting immediate pressure on stock prices.
Trader's Roadmap: Key Levels of Two Major Indices In the current market environment with obvious differentiation, adopting a unified trading strategy is often difficult to be effective. Investors need to analyze the technical structure of each major index separately and find the key support and resistance areas that determine the balance of long and short forces.
S&P 500 Index: Long Short Boundary For S&P 500 The key to an index is to observe its performance near the recent consolidation area. If it can hold above this equilibrium range, it indicates that the buyer is successfully absorbing selling pressure or laying the foundation for subsequent upward movement. However, if this range falls, it means that Nasdaq's bearish sentiment is beginning to spread to a wider market, implying that bears are regaining the initiative.
NASDAQ Index: Key support levels facing test The situation of the Nasdaq index is even more precarious, and its support level is also more critical. If the current short-term support zone cannot be held, it will confirm the existing bearish trend and may become a catalyst for accelerating the wave of selling. In such high volatility markets, execution efficiency is crucial. The deep liquidity provided by our platform can ensure that your orders are quickly executed at the ideal price. This will become a significant advantage when key technological breakthroughs are made.
If S&P 500 If the index can maintain a neutral trend and eventually break through, it is expected to bring enough boost to the entire market, thereby driving the lagging Nasdaq index higher. On the contrary, if the bearish sentiment of the Nasdaq index further intensifies and falls below key support levels, it may indicate a broader wave of risk aversion, which will ultimately drag down S&P as well 500 The index is declining. Faced with such uncertainty, traders should leverage Aurra Markets A trading calculator that simulates scenarios for long and short positions is crucial for managing risk in segmented markets.
Key Summary - The current market is showing significant differentiation:S&P 500 indexIn a neutral state, andNASDAQ IndexStill leaning towards a downward trend.
- The current trend is likely to reflect sector rotation, with funds flowing from growth technology stocks to value assets.
- The Nasdaq index is more sensitive to expectations of interest rate hikes, which explains its relatively weak performance.
- The two major indices need to be independently analyzed and traded based on their respective key technical positions.
- The Nasdaq index's breakout downward trend may ultimately drag downS&P 500 indexLower, and vice versa.
In the current market environment, which non tech sectors do you think have the best chance of outperforming the market for the rest of this year? Welcome to share your opinions in the comment section.
Risk Disclosure:Any opinions, news, research, analysis, quotations or other information contained on this website are for general market commentary purposes only, for reference purposes only, and do not constitute any investment advice.Aurra Markets We shall not be liable for any loss or damage (including but not limited to any loss of profit) directly or indirectly caused by the use or reliance on such information.
about Aurra Markets Retail traders also deserve to enjoy an institutional level trading environment.Aurra Markets Directly send your MT5 The trading terminal is connected to a deep liquidity pool, allowing you to enjoy an efficient trading experience with lower spreads and zero duplicate quotes. As a digital broker, we provide efficient deposit services to seamlessly connect transactions.
| 

 金价行情狂泻,黄金不再“牛”?SINO
之前一路狂飙的黄金近日突然开启跳水模式,很多人都在热议:黄金是不是牛市彻底凉了?
 Aurra Markets:黄金跌势延续,实际
黄金跌势为何加速?黄金价格已明确跌破关键支撑位,释放出跌势可能加速的信号。本轮
 Aurra Markets:Anthropic IPO 备受
Anthropic blockbuster IPO 将如何影响股市?Anthropic 近期的首次公开募股(IPO)成为科技
 汉声集团:持续鹰调,黄金行情继续大
昨晚国际现货黄金继续下行,盘中最低跌至3620.18dollar/Ounces, final settlement3625.05dollar/ounce
 Aurra Markets:【美元兑日元走势预
美元兑日元的涨势为何遇阻?受利率差显著有利于美元的推动,美元兑日元持续成为市场





 Riser card
 Top card
 Silence card
 Color changing card
 lifting jack