Register now, make more friends, enjoy more functions, and let you play in the community easily.
You need Sign in Can be downloaded or viewed without an account?Register Now 
x
This post was finally written by Aurra_Official to 2026-5-28 14:53 edit
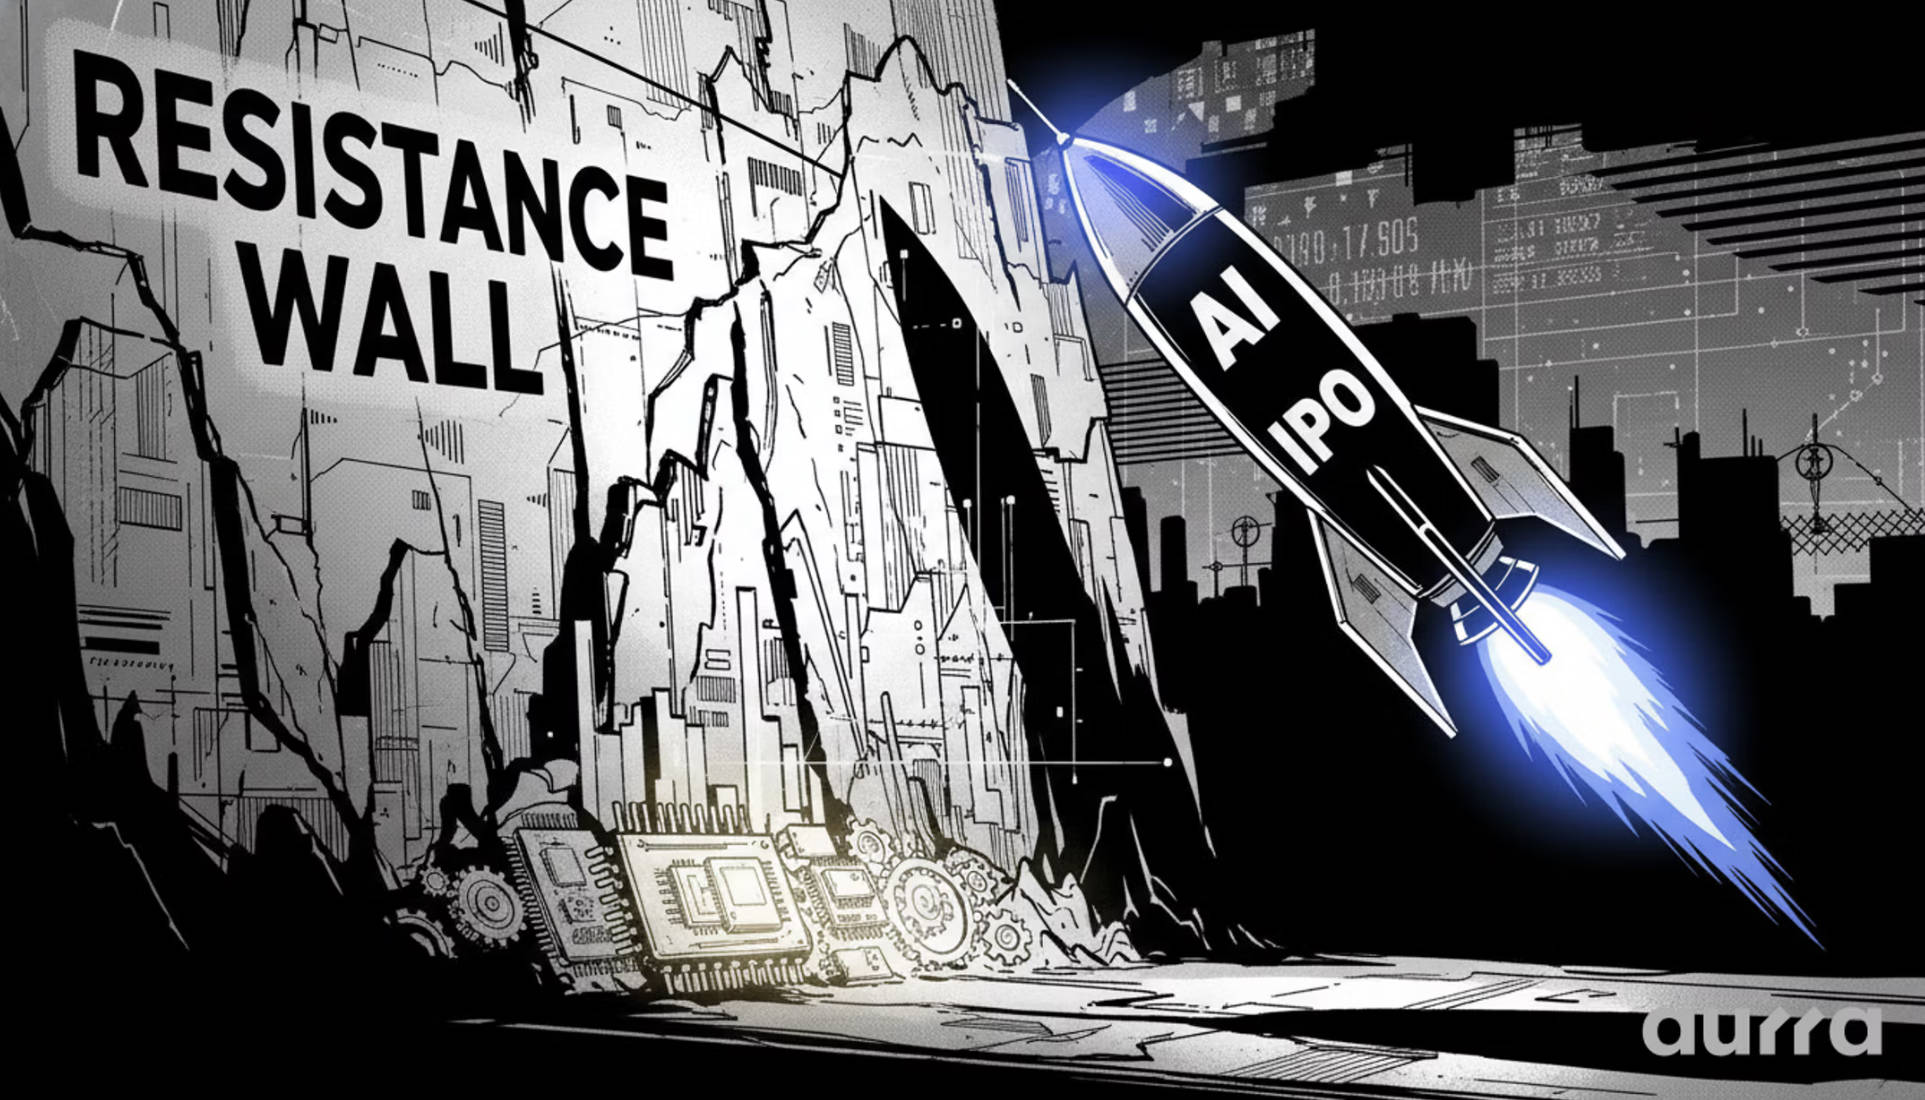
AI IPO Can the hype drive the Nasdaq index to break through key resistance levels? NASDAQ 100 The index is approaching an important technical resistance zone, while market sentiment is affected“AI Potential giants IPO”Strong narrative support, including SpaceX、OpenAI Expectations of high attention technology companies potentially going public. This marks a critical turning point for the current market: once effectively broken through, it may initiate a new round of upward trend; If it is hindered from falling back, it may trigger a temporary technical adjustment.
Different from the Internet foam period, this round AI The market is driven more by real and massive infrastructure demand rather than pure valuation speculation. This structural difference provides more solid fundamental support for the current upward trend, but it does not eliminate the downside risk caused by short-term market overheating. Meanwhile, as“AIThe continued strength of the semiconductor sector, which was known as the "shovel seller" during the gold rush, further confirms the authenticity of potential demand and makes the current technical long short game increasingly decisive for the future direction of the market.
Fundamental driven: Beyond the concept hype cycle The current market is balancing simultaneously AI Long term growth narrative and short-term macro and geopolitical variables. Despite the potential for high-quality technology companies IPO Strong growth expectations are expected, but traders still need to be vigilant about the volatility risks that may arise from multiple external factors.
a new round AI Industrial Revolution around SpaceX、OpenAI and Anthropic The frenzy brought about by the possibility of a company going public is not just driven by speculative sentiment. These enterprises are building new industrial foundations, driving real demand for cloud computing, data centers, and high-performance chips. This constitutes a real demand support, which makes the current environment different from the previous technology foam, and provides a convincing reason for long-term bullish, which can support investor confidence even during the short-term correction.
Semiconductor as a leading indicator With the beauty of light(Micron)The significant strengthening of semiconductor stocks represented by, strongly confirms AI The rationality of narrative. These companies are AI The direct beneficiaries of infrastructure construction. When chip stocks rise in sync with the Nasdaq index, it indicates that the market's risk appetite is based on actual supply chain demand rather than single concept speculation, thereby enhancing investors' confidence in the continuation of technological leadership.
Geopolitical Disturbances although AI The theme dominates market discussions, but secondary geopolitical events such as the possibility of reaching an agreement with Iran also bring uncertainty. Such events may affect overall market sentiment and risk appetite, thereby putting pressure on risk assets such as Nasdaq. Although not the main driving force, these factors are still worth paying attention to as they may trigger unexpected fluctuations, as maintaining a strict risk management system is crucial.
Technology Outlook: Analysis of Key Multi air Battlegrounds The price trend has validated the current market narrative, and the Nasdaq index is at a critical technical watershed. Although the index has previously performed strongly, it is now approaching a clear historical resistance zone where selling pressure has occurred multiple times in the past. The analysis of these key price points is crucial for determining entry, exit, and risk management points.
Key resistance zone:30118-30159 This price range is currently the most significant obstacle facing the Nasdaq index. If the index fails to stabilize above the region, it means that the upward momentum is weakening and the market may need to undergo consolidation or correction to attract new buying. On the contrary, once the index decisively breaks through and stabilizes 30162 Above, it will constitute a significant technical breakthrough signal, indicating that the main upward trend is expected to continue and may launch an impact towards higher prices.
Support level recognition in callback scenarios If the resistance level effectively suppresses the upward trend, the first key support range at the tactical level is located at 30040–30075This region is expected to receive short-term bullish active defense. If the index falls below this range, the probability of a deeper pullback increases, and the next major support level is at 29996This level is crucial: once breached, it will confirm a short-term bearish trend and open up higher upward space.
Analysis of Trading Volume and Momentum Indicators To confirm30162An effective breakthrough above must be accompanied by a significant increase in volume. High trading volume means confidence in institutional buying, while reducing the possibility of "false breakthroughs". Traders should also closely monitorRSIEqual momentum index; If there is no overbought reading accompanying the breakthrough, it indicates that there is still sufficient room for upward movement, which will add confidence to the long position.
Overall market impact and trading strategy The trend of the Nasdaq index does not exist in isolation, and its price changes have a wide-ranging impact on the overall risk asset market. In such technology driven markets, understanding cross asset linkage and conducting effective risk management is particularly important.
Cross asset correlation: NASDAQ index vs. Russell 2000 index Observing NASDAQ 100 Index and Russell, representing small cap stocks in the United States 2000 The relative performance between broader indicators such as indices is crucial. If Nasdaq rises while Russell 2000 Index lag indicates that the market strength is concentrated in a few super large cap stocks, rather than a comprehensive rise. This differentiation may be a warning signal of a narrowing market breadth, sometimes indicating the approach of a larger scale correction.
Cost Management in Trendy Markets In a market environment dominated by clear technological structures, execution efficiency is crucial. Even small price drops or transaction costs can significantly affect long-term earnings performance. Therefore, controlling transaction costs is a key component of trend trading strategies.
Scenario deduction: Path of the next trading day The future direction depends on the market's response to key resistance levels 30162 The reaction. If the Nasdaq index breaks through and stabilizes above this price, the upward trend is expected to accelerate, attracting new buying interest to enter. This scenario provides clear signals for trend tracking strategies. To seize this opportunity, traders should make plans in advance. You can go directly to MetaTrader 5(MT5)Price reminders are set up on the platform for this key level to ensure that notifications can be received immediately when a breakthrough occurs, thereby achieving rapid and efficient execution.
Key Summary - suffer AI Concept stock IPO Driven by the trend, the Nasdaq index is facing key resistance levels(30118–30159)The test.
- Different from previous foam, this round of rise has more solid fundamental support, mainly fromAIThe real infrastructure demand driven by the industrial chain.
- If the index breaks through 30162May initiate a new round of upward trend; If it is hindered from falling back, it may lead to 30040 or 29996 Expand the callback on the front line.
- The sustained strength of the semiconductor sector is contributing to the overall growth AI Narrative provides important fundamental validation signals.
- In the current market environment, the accuracy and cost control of trading execution are particularly crucial, and low trading costs and low spreads demonstrate significant advantages in strategy execution.
The current market is playing a wonderful game between strong narrative and key technological resistance. How would you view the long-term situation in the face of such a pattern AI The trade-off between development prospects and short-term pullback risks?
Risk Disclosure: Any opinions, news, research, analysis, quotations, or other information contained on this website are for general market commentary purposes only, for reference purposes only, and do not constitute any investment advice.Aurra Markets We shall not be liable for any loss or damage (including but not limited to any loss of profit) directly or indirectly caused by the use or reliance on such information.
about Aurra Markets Retail traders also deserve to enjoy an institutional level trading environment.Aurra Markets Directly send your MT5 The trading terminal is connected to a deep liquidity pool, allowing you to enjoy an efficient trading experience with lower spreads and zero duplicate quotes. As a digital broker, we provide efficient deposit services to seamlessly connect transactions.
| 

 金价行情狂泻,黄金不再“牛”?SINO
之前一路狂飙的黄金近日突然开启跳水模式,很多人都在热议:黄金是不是牛市彻底凉了?
 Aurra Markets:黄金跌势延续,实际
黄金跌势为何加速?黄金价格已明确跌破关键支撑位,释放出跌势可能加速的信号。本轮
 Aurra Markets:Anthropic IPO 备受
Anthropic blockbuster IPO 将如何影响股市?Anthropic 近期的首次公开募股(IPO)成为科技
 汉声集团:持续鹰调,黄金行情继续大
昨晚国际现货黄金继续下行,盘中最低跌至3620.18dollar/Ounces, final settlement3625.05dollar/ounce
 Aurra Markets:【美元兑日元走势预
美元兑日元的涨势为何遇阻?受利率差显著有利于美元的推动,美元兑日元持续成为市场





 Riser card
 Top card
 Silence card
 Color changing card
 lifting jack