Register now, make more friends, enjoy more functions, and let you play in the community easily.
You need Sign in Can be downloaded or viewed without an account?Register Now 
x
todayUltimaMarkets Bringing you 2024year 7month 3OfA50indexIn depth analysis.
Fundamental points - 美联储难降息:尽管昨日美联储主席鲍威尔仍未明确夏季是否降息,但是透露出劳动市场已经出现重大进展。不过数据层面来看,可能并非如此。欧海运价格暴涨, 空缺职位数反弹, 银行信贷增速走高。美联储年内能否降息,还是要打个大大的问号。
- A股财报季:本周开始将迎中报密集披露期,A50及消费龙头+供需改善短期。在A股连续下跌保住3000点大关口之际,A50有一定超跌反弹的概率。
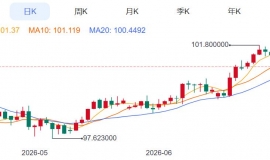
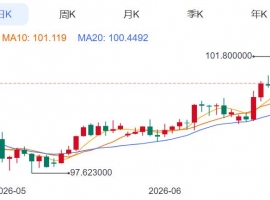
technical analysis Daily chart analysis (A50指数的日线图,来源Ultima Markets MT4)
- Random oscillation index:指标在超卖区域第三次发出多头信号,同时也再度出现底背离的形态。昨日指数价格最终出现明显的看涨蜡烛线,暗示当前反弹概率极大,值得关注短期做多交易机会。
- 均线组:昨日尽管快速上冲,但是上方仍然是阻力重重。红色33日均线和黑色65日均线是目标阻力价位。若无法突破该均线阻力,则短期均线或将发出空头信号,届时指数将迎来进一步下跌。
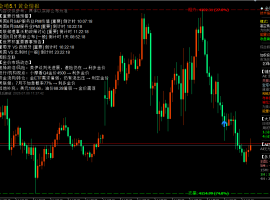
4Hour chart analysis (A50Exponential4Hour chart, sourceUltima Markets MT4)
- Random oscillation index:指标进入超买区域即将发出空头信号,暗示当前多头情绪放缓,后续或将略做调整。
- 阻力区域:指数在快速突破黑色65周期均线后,遇阻两根重要阻力线——另类趋势线和下行趋势线。联合的阻力区域让指数短期难以进一步快速上冲。
- 123rule:若指数价格突破刚才提及的阻力后再回踩上涨,则是典型的123形态,或将迎来长线上涨趋势。
Trading CentralHub Line Indicators (A50Exponential30Minute chart, sourceUltima Markets APP)
- according toUltima Markets APPInTradingCentralHub line indicators, central price range for the day11980,
- 11980Upward bullish, first goal12120Second objective12165
- 11980Under bearish, first target11940Second objective11880
Disclaimers The comments, news, research, analysis, pricing, and other information contained in this article can only be considered as general market information and are provided solely to assist readers in understanding the market situation and do not constitute investment advice.UltimaMarketsReasonable measures have been taken to ensure the accuracy of the data, but the accuracy of the data cannot be guaranteed and can be changed at any time without notice.UltimaMarketsWe will not be responsible for any losses or losses (including but not limited to any loss of profits) that may arise from the direct or indirect use or reliance on such information.
| 

 ZFX山海证券:金价反弹受阻!
Monday(7month6日),现货黄金盘初一度冲至每盎司4202.09The US dollar, created by6month22日以来的两周新
ZFX山海证券:金价反弹受阻!
Monday(7month6日),现货黄金盘初一度冲至每盎司4202.09The US dollar, created by6month22日以来的两周新
 Aurra Markets:【美元走势分析】美
疲软就业报告将如何重塑市场格局?最新美国就业报告释放出劳动力市场降温信号,推动
Aurra Markets:【美元走势分析】美
疲软就业报告将如何重塑市场格局?最新美国就业报告释放出劳动力市场降温信号,推动
 Aurra Markets:OPEC+ 提高产量,霍
OPEC+ 增产获批,将如何影响全球原油市场?O OPEC+正式批准进一步上调原油产量配额
Aurra Markets:OPEC+ 提高产量,霍
OPEC+ 增产获批,将如何影响全球原油市场?O OPEC+正式批准进一步上调原油产量配额
 钱塘论道,安全为基 | ZFX 山海证券
7 month 4 Day, by ZFX Organized by Shanhai Securities and Huiyou Post Station "2026 交易技术峰会・杭州站" 在美丽
钱塘论道,安全为基 | ZFX 山海证券
7 month 4 Day, by ZFX Organized by Shanhai Securities and Huiyou Post Station "2026 交易技术峰会・杭州站" 在美丽
 7month6日早上黄金策略:金价回落到关键
现在北京时间大概是7month6day11spot36分,现货黄金目前参考4166dollar/盎司附近。你平
7month6日早上黄金策略:金价回落到关键
现在北京时间大概是7month6day11spot36分,现货黄金目前参考4166dollar/盎司附近。你平


 Riser card
 Top card
 Silence card
 Color changing card
 lifting jack