Register now, make more friends, enjoy more functions, and let you play in the community easily.
You need Sign in Can be downloaded or viewed without an account?Register Now 
x
todayUltimaMarkets Bringing you 2024year 3month 20Bitcoin in JapanIn depth analysis.
Fundamental points - The impact of the hawkish policies of the Federal ReserveAs expectations of the Federal Reserve's significant policy easing fade, the market is focused on the economic forecast released early tomorrow morning. If the dot matrix chart shows that the policy will further reduce interest rate cuts, the US dollar index may experience a significant increase.
- Bitcoin is influenced by policies:BTCUSDIt is denominated in US dollars, and assets denominated in US dollars naturally have a negative correlation with the US dollar, so the Federal Reserve's monetary policy expectations will to some extent affect changes in Bitcoin prices. If the Federal Reserve does not release hawkish signals tonight, there is hope for a rebound in Bitcoin.
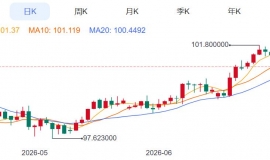
technical analysis Daily chart analysis Daily chart of Bitcoin, sourceUltima Markets MT4)
- Random oscillation index:3After the mid month indicator issued a bearish signal, both the fast and slow lines fell below yesterday50The median line suggests that bears will have the upper hand in the short term.
- Supporting price rangeThe market price is currently close to red33The daily moving average is also a supporting price range for alternative trend lines in the early stage. Be wary of Bitcoin's recent rebound trend. If it cannot break through its previous high, it may continue to decline and make deep adjustments after completing its head and shoulder top building pattern.
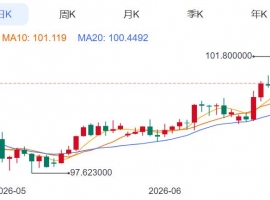
1Hour chart analysis (Bitcoin)1Hour chart, sourceUltima Markets MT4)
- Random oscillation indexThere are signs of entanglement and volatility in the overbought area of the indicator, which may send a bullish signal, indicating that the short-term adjustment of Bitcoin's decline is coming to an end. Wait for the signal to be clear before paying attention to long opportunities.
- Downward channel lineThe market price is approaching the lower edge of the downward channel, and this price level is also200The cyclical moving average is likely to see a rebound and upward trend in prices.
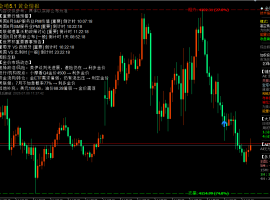
Trading CentralHub Line Indicators (Bitcoin)30Minute chart, sourceUltima Markets APP)
- according toUltima Markets APPInTradingCentralHub line indicators, central price range for the day62760,
- 62760Upward bullish, first goal65620Second objective66330
- 62760Under bearish, first target61580Second objective60870
Disclaimers The comments, news, research, analysis, pricing, and other information contained in this article can only be considered as general market information and are provided solely to assist readers in understanding the market situation and do not constitute investment advice.UltimaMarketsReasonable measures have been taken to ensure the accuracy of the data, but the accuracy of the data cannot be guaranteed and can be changed at any time without notice.UltimaMarketsWe will not be responsible for any losses or losses (including but not limited to any loss of profits) that may arise from the direct or indirect use or reliance on such information.
| 
 ZFX山海证券:金价反弹受阻!
Monday(7month6日),现货黄金盘初一度冲至每盎司4202.09The US dollar, created by6month22日以来的两周新
ZFX山海证券:金价反弹受阻!
Monday(7month6日),现货黄金盘初一度冲至每盎司4202.09The US dollar, created by6month22日以来的两周新
 Aurra Markets:【美元走势分析】美
疲软就业报告将如何重塑市场格局?最新美国就业报告释放出劳动力市场降温信号,推动
Aurra Markets:【美元走势分析】美
疲软就业报告将如何重塑市场格局?最新美国就业报告释放出劳动力市场降温信号,推动
 Aurra Markets:OPEC+ 提高产量,霍
OPEC+ 增产获批,将如何影响全球原油市场?O OPEC+正式批准进一步上调原油产量配额
Aurra Markets:OPEC+ 提高产量,霍
OPEC+ 增产获批,将如何影响全球原油市场?O OPEC+正式批准进一步上调原油产量配额
 钱塘论道,安全为基 | ZFX 山海证券
7 month 4 Day, by ZFX Organized by Shanhai Securities and Huiyou Post Station "2026 交易技术峰会・杭州站" 在美丽
钱塘论道,安全为基 | ZFX 山海证券
7 month 4 Day, by ZFX Organized by Shanhai Securities and Huiyou Post Station "2026 交易技术峰会・杭州站" 在美丽
 7month6日早上黄金策略:金价回落到关键
现在北京时间大概是7month6day11spot36分,现货黄金目前参考4166dollar/盎司附近。你平
7month6日早上黄金策略:金价回落到关键
现在北京时间大概是7month6day11spot36分,现货黄金目前参考4166dollar/盎司附近。你平


 Riser card
 Top card
 Silence card
 Color changing card
 lifting jack