Register now, make more friends, enjoy more functions, and let you play in the community easily.
You need Sign in Can be downloaded or viewed without an account?Register Now 
x
FTSE 100、DAX 40、RUSSELL 2000 - Analysis and charts
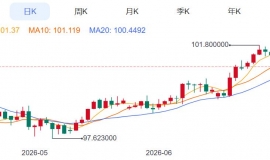
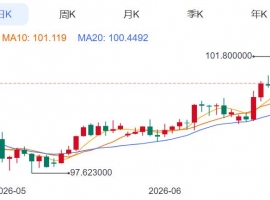
Fushi100Index recovery and rise As traders wait for more data this week to guide the economic and monetary policy outlook, FTSE 100 The index is rebounding to last week's six week high 7,543 Point. The index is currently once again above 55 Daily Simple Moving Average (Moving Average) (SMA) be located 7,485 Point, target is 11 Month and current 12 Monthly high point 7,535 to 7,543 Point. Above this resistance region, there is 200 Daily Simple Moving Average (SMA), located in 7,571 Points. 55 Daily moving average 7,485 Point sum 11 High point at the beginning of the month 7,484 The support below the point is at Tuesday's low point 7,459 Points. Fushi 100 Daily chart

DAX 40Index reaches a historic high Despite the first decline in orders from German factories in three months,DAX 40 The index continues to rise. The index was on Tuesday 16,600 Create near the point 7 Monthly high point 16,532 A new record high for points. Further increase indicates 17,000 The small psychological barrier of the point. Short term upward pressure will remain, but it will not fall below Friday's low point 16,237 Point. Above it can be found 12 month 1 Daily high point 16,463 Point and Tuesday low point 16,391 Find a small support nearby. DAX 40 Daily chart

Russell2000The index trading price is close to a three-month high Russell 2000 The index is from the United States stock market indexThe worst performing company has only seen an increase so far this year 6%Despite the United States JOLTS The work was far weaker than expected, but it has been achieved so far 9 The level of the last transaction in mid month has risen so far 1,885 Open your mouth. Today's ADP Employment data, and more importantly, Friday's non farm payroll data should provide investors with a better understanding of the state of the US labor market. Ascending and breaking 1,885 Pointing and aiming 9 Monthly high point 1,931 Points, but fell below Tuesday's low point 1,854 Points may touch 11 Mid month high point200 Daily Simple Moving Average (SMA) as well as 11 Month to 12 Monthly uptrend line1,833 to 1,817 Accessing again. Russell 2000 Daily chart

| 

 ZFX山海证券:金价反弹受阻!
Monday(7month6日),现货黄金盘初一度冲至每盎司4202.09The US dollar, created by6month22日以来的两周新
ZFX山海证券:金价反弹受阻!
Monday(7month6日),现货黄金盘初一度冲至每盎司4202.09The US dollar, created by6month22日以来的两周新
 Aurra Markets:【美元走势分析】美
疲软就业报告将如何重塑市场格局?最新美国就业报告释放出劳动力市场降温信号,推动
Aurra Markets:【美元走势分析】美
疲软就业报告将如何重塑市场格局?最新美国就业报告释放出劳动力市场降温信号,推动
 Aurra Markets:OPEC+ 提高产量,霍
OPEC+ 增产获批,将如何影响全球原油市场?O OPEC+正式批准进一步上调原油产量配额
Aurra Markets:OPEC+ 提高产量,霍
OPEC+ 增产获批,将如何影响全球原油市场?O OPEC+正式批准进一步上调原油产量配额
 钱塘论道,安全为基 | ZFX 山海证券
7 month 4 Day, by ZFX Organized by Shanhai Securities and Huiyou Post Station "2026 交易技术峰会・杭州站" 在美丽
钱塘论道,安全为基 | ZFX 山海证券
7 month 4 Day, by ZFX Organized by Shanhai Securities and Huiyou Post Station "2026 交易技术峰会・杭州站" 在美丽
 7month6日早上黄金策略:金价回落到关键
现在北京时间大概是7month6day11spot36分,现货黄金目前参考4166dollar/盎司附近。你平
7month6日早上黄金策略:金价回落到关键
现在北京时间大概是7month6day11spot36分,现货黄金目前参考4166dollar/盎司附近。你平


 Riser card
 Top card
 Silence card
 Color changing card
 lifting jack