马上注册,结交更多好友,享用更多功能,让你轻松玩转社区。
您需要 登录 才可以下载或查看,没有账号?立即注册 
x
美元预测 – 欧元/美元、美元/日元、澳元/美元、黄金- 以 DXY 指数衡量的美元因美国债券收益率飙升而上涨
- 鲍威尔的鹰派言论强化了美元的上涨
- 本文从技术角度审视欧元/美元、美元/日元、澳元/美元和黄金价格,分析未来几天需要关注的关键水平
美元开盘时基调低迷,但在重要国债拍卖中对美国政府债券的需求低迷后,收益率飙升,推动美元在下午交易中反弹。随后,美联储主席鲍威尔在国际货币基金组织组织的一次小组会议上发表的鹰派言论增强了美元的上涨势头。 联邦公开市场委员会(FOMC)主席在公开讲话中表示,政策制定者对他们是否已采取足够的限制立场以持续将通胀率恢复至2.0%的目标没有信心。他还表示,不能保证在冷却价格压力方面取得进一步进展,更强劲的增长可能需要更高的利率。归根结底,DXY 指数当天上涨了近 0.4%。 总而言之,鲍威尔的言论表明央行并非100%相信加息周期已经结束。这可能意味着下个月或一月份可能再次加息,特别是如果金融状况继续缓解,就像十月底以来的情况一样(科技股一直在看涨,忽略了今天的表现)。 目前,预期仍将处于不断变化的状态,情绪会随着数据发布的强弱而变化。因此,交易者必须密切关注未来几天和几周的经济日历。尽管如此,一项值得关注的重要报告是将于下周二发布的 10 月份消费者价格指数调查。 分析师预测,经季节调整后,上个月总体 CPI 预计上涨 0.1%,年率从此前的 3.7% 降至 3.3%。核心指标预计每月上涨 0.3%,年度读数为 4.3%,与 9 月份持平。 由于美联储对即将到来的信息高度敏感并担心通胀风险,官方数据与共识预期的任何上行偏差都将推高债券收益率,并强化长期加息的理由。这种情况对美元有利,但对黄金、欧元、澳元和日元不利。
欧元/美元技术分析在遭遇斐波那契阻力位1.0765的拒绝后,欧元/美元经历了快速回调,目前汇价徘徊于支撑区间下限1.0650。多头必须不惜一切代价捍卫这一底部——否则可能会导致该货币对摇摇欲坠,推动价格逼向趋势线支撑位1.0555。若进一步走软,则有可能重新测试 2023 年低点。 如果市场转向且情绪波动有利于多头,则第一个值得关注的技术障碍将出现在 1.0765,其中 200 日简单移动平均线与 7 月/10 月下跌的 38.2% 斐波那契回撤位一致。克服关键水平的汇合可能会增强看涨势头,为迈向 1.0840 铺平道路。 欧元/美元技术图表
美元/日元技术分析美元/日元上周回调,但重新确立了上行势头,突破了 150.90 的重要上限,并冲向 2022 年和 2023 年高点,略低于心理关口 152.00。随着价格看涨并接近重要的科技区,交易员应谨慎行事,因为东京可能随时介入以抑制投机活动并防止日元进一步贬值。 如果日本当局进行外汇干预,美元/日元可能会迅速跌破150.90并跌向149.00关口。若进一步走软,焦点将转向 147.25,随后是 146.00。如果东京不介入货币市场并允许汇价升至 152.00 上方,则有可能反弹至中期上升通道上限 153.40。 美元/日元技术图表
澳元/美元技术分析澳元/美元周四连续第四个交易日下跌,抹去了上周牛市突破后积累的所有涨幅,结果证明这是一次假突破。此次回调后,该货币对已到达0.6350附近的重要支撑位。该区域级别的完整性至关重要;如果未能维持该水平,可能会导致跌向 0.6325。如果进一步疲软,可能会再次触及今年的低点。 尽管澳元近期遭遇挫折,但不应完全忽视看涨前景。也就是说,如果多头卷土重来并引发当前水平反弹,上方阻力位将出现在 0.6400 附近,然后是 0.6460。成功克服这一技术障碍可能会重新点燃看涨势头,为反弹至 11 月高点 0.6500 附近打开大门。 澳元/美元技术图表
黄金技术分析本周早些时候,当多头未能突破 2,010 美元/2,015 美元区域的关键上限时,金价反转走低。然而,XAU/美元在这次挫折后开始上涨,价格在小幅反弹之前在 200 日简单移动平均线附近遇到支撑。如果未来交易日涨幅加快,初步阻力位将出现在 1,980 美元,随后是 2,010 美元/2,015 美元。 相反,如果卖家回归并重新在金融市场占据上风,则需要监控的第一层位置为 1,945 美元,该位置与 200 日移动平均线一致。尽管金价可能在回调期间在该区域站稳脚跟,但若跌破则可能会跌向 1,920 美元。低于该区域,焦点转向 1,900 美元。 黄金价格走势图(期货合约)
| 

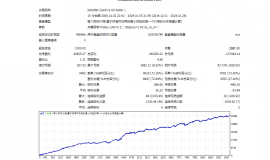
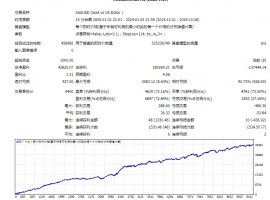 【无敌黄金】一单一结
本EA为MT4平台专属现货黄金自动化交易程序,核心采用严格一单一结机制,同一时段仅持
【无敌黄金】一单一结
本EA为MT4平台专属现货黄金自动化交易程序,核心采用严格一单一结机制,同一时段仅持
 7月10日午后黄金策略:金价回落至411
目前消息面对黄金还是偏压制。市场对美国利率继续维持高位、甚至进一步收紧的预期有
7月10日午后黄金策略:金价回落至411
目前消息面对黄金还是偏压制。市场对美国利率继续维持高位、甚至进一步收紧的预期有
 ZFX山海证券:金价惊险重返4100美元
7月9日,国际黄金市场上演了一场惊心动魄的逆转大戏。在经历了连续三个交易日的下跌之
ZFX山海证券:金价惊险重返4100美元
7月9日,国际黄金市场上演了一场惊心动魄的逆转大戏。在经历了连续三个交易日的下跌之
 ZFX山海证券:金价坚守4000关口!
周三(7月8日)现货黄金价格一度跌至4020美元附近,油价应声暴涨逾5%,刷新逾两周高点
ZFX山海证券:金价坚守4000关口!
周三(7月8日)现货黄金价格一度跌至4020美元附近,油价应声暴涨逾5%,刷新逾两周高点
 7月9日早上黄金策略:金价深V反弹后
昨晚黄金走了一波急跌,盘中一度逼近4020关口,随后展开深V反弹收复大部分跌幅,最
7月9日早上黄金策略:金价深V反弹后
昨晚黄金走了一波急跌,盘中一度逼近4020关口,随后展开深V反弹收复大部分跌幅,最


 提升卡
提升卡 置顶卡
置顶卡 沉默卡
沉默卡 变色卡
变色卡 千斤顶
千斤顶