goldThe recent trend can be described as a roller coaster.
At last week's discussion meeting with the central bank, the Chairman of the Federal Reserve emphasized that the interest rate hike process for the year will not stop. The subsequent data also cooled investors' expectations for the Fed's interest rate cut this year, which to some extent boosted the rebound of the US dollar and bearish precious metals. But with the latest manufacturing report released by the United States yesterdayISMData, Gold from the Line of Life and Death1900dollar/The intraday low of ounces rose again, with gains exceeding20USD.
2023year6OfISMmanufacturingPMIfrom5Of46.9lower46Below predicted47. This is2020year5The new low since the beginning of the month, but also a continuous one8Months below the boom bust line50Below. This data indicates that since2020year5Since the beginning of the month, the contraction rate of the manufacturing industry has been faster, as the weakness continues and the impact on2023The optimism in the second half of the year weakened, and the management output of enterprises decreased.
(USAISMManufacturing index trend over the past year
The expectation of economic recession is a booster for gold. Amidst the deepening of the inversion of US Treasury bonds, the sluggish global economic outlook has resulted in the inability of gold prices to effectively fall below1900The integer level of the US dollar. Due to the fact that gold prices have already taken into account many recession and tightening expectations, the long and short positions of gold prices are actually the last straw.
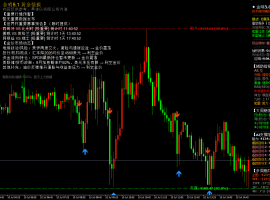
(CFTCGold Asset Management Position Trends)
From the perspective of capital flow, speculative funds come from2Starting from the end of the month, we will gradually increase our holdings, and the price of gold will also increase3At the beginning of the month, it started to rise with the trend, and from then on5At the beginning of the month, speculative funds have gradually started to profit and reduce their positions, and their net positions continue to decrease.
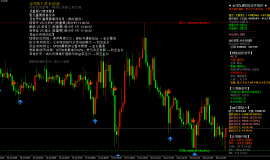
(Gold daily chart, sourceUlitima Markets MT4)
Gold from2018Since the beginning of the bull market in the year,200The daily moving average always creates effective resistance to movement, and in2020After falling below in the third quarter of the year, the market entered a continuous oscillation. Recently, prices have fallen again to200Near the daily moving average, and this area is also1900The integer level of the US dollar.
(Gold daily chart, sourceUlitima Markets MT4)
from4Judging from the downward adjustment trend since the end of the month, the market has arrived61.8%Near the Fibonacci expansion level, there are signs of a rebound in gold prices in the near future.
7The first week of the month will see US employment market data, and if wage data further increases in the non-farm payroll report, the market's inflation expectations will deepen again. It is expected that the Federal Reserve will find it extremely difficult to adjust its monetary policy, and may choose to raise interest rates in the remaining interest rate resolutions this year, which will to some extent suppress the rebound momentum of gold.
Disclaimers
The comments, news, research, analysis, pricing, and other information contained in this article can only be considered as general market information and are provided solely to assist readers in understanding the market situation and do not constitute investment advice.UltimaMarketsReasonable measures have been taken to ensure the accuracy of the data, but the accuracy of the data cannot be guaranteed and can be changed at any time without notice.UltimaMarketsWe will not be responsible for any losses or losses (including but not limited to any loss of profits) that may arise from the direct or indirect use or reliance on such information.

 7month10日午后黄金策略:金价回落至411
目前消息面对黄金还是偏压制。市场对美国利率继续维持高位、甚至进一步收紧的预期有
7month10日午后黄金策略:金价回落至411
目前消息面对黄金还是偏压制。市场对美国利率继续维持高位、甚至进一步收紧的预期有
 ZFX山海证券:金价惊险重返4100dollar
7month9日,国际黄金市场上演了一场惊心动魄的逆转大戏。在经历了连续三个交易日的下跌之
ZFX山海证券:金价惊险重返4100dollar
7month9日,国际黄金市场上演了一场惊心动魄的逆转大戏。在经历了连续三个交易日的下跌之
 ZFX山海证券:金价坚守4000Pass!
Wednesday(7month8日)现货黄金价格一度跌至4020美元附近,油价应声暴涨逾5%,刷新逾两周高点
ZFX山海证券:金价坚守4000Pass!
Wednesday(7month8日)现货黄金价格一度跌至4020美元附近,油价应声暴涨逾5%,刷新逾两周高点
 7month9日早上黄金策略:金价深V反弹后
昨晚黄金走了一波急跌,盘中一度逼近4020关口,随后展开深V反弹收复大部分跌幅,最
7month9日早上黄金策略:金价深V反弹后
昨晚黄金走了一波急跌,盘中一度逼近4020关口,随后展开深V反弹收复大部分跌幅,最
 ZFX山海证券:金价被油价大涨压制!
Tuesday(7month7日),油价大幅飙升,现货黄金当日下跌1.42%, receive reports per ounce4105美元,盘中一
ZFX山海证券:金价被油价大涨压制!
Tuesday(7month7日),油价大幅飙升,现货黄金当日下跌1.42%, receive reports per ounce4105美元,盘中一


![Ultima Markets: [Market Hotspot] Gold1900Life and death line Non farm employment or success...453 / author:Ultima_Markets / PostsID:1723199](data/attachment/forum/202307/04/154910mam925z6iv95wmmp.jpg "Ultima Markets: [Market Hotspot] Gold1900Life and death line Non farm employment or success...453 / author:Ultima_Markets / PostsID:1723199")
![Ultima Markets: [Market Hotspot] Gold1900Life and death line Non farm employment or success...84 / author:Ultima_Markets / PostsID:1723199](data/attachment/forum/202307/04/154925k2elpmin7zg3lky2.png "Ultima Markets: [Market Hotspot] Gold1900Life and death line Non farm employment or success...84 / author:Ultima_Markets / PostsID:1723199")
![Ultima Markets: [Market Hotspot] Gold1900Life and death line Non farm employment or success...776 / author:Ultima_Markets / PostsID:1723199](data/attachment/forum/202307/04/154932zp4xyxrpvjjhx251.png "Ultima Markets: [Market Hotspot] Gold1900Life and death line Non farm employment or success...776 / author:Ultima_Markets / PostsID:1723199")
![Ultima Markets: [Market Hotspot] Gold1900Life and death line Non farm employment or success...173 / author:Ultima_Markets / PostsID:1723199](data/attachment/forum/202307/04/154944cx9ksa9akarxr99h.png "Ultima Markets: [Market Hotspot] Gold1900Life and death line Non farm employment or success...173 / author:Ultima_Markets / PostsID:1723199")
![Ultima Markets: [Market Hotspot] Gold1900Life and death line Non farm employment or success...124 / author:Ultima_Markets / PostsID:1723199](data/attachment/forum/202307/04/155001olefhule0qft750h.png "Ultima Markets: [Market Hotspot] Gold1900Life and death line Non farm employment or success...124 / author:Ultima_Markets / PostsID:1723199")
 Riser card
 Top card
 Silence card
 Color changing card
 lifting jack