Register now, make more friends, enjoy more functions, and let you play in the community easily.
You need Sign in Can be downloaded or viewed without an account?Register Now 
x
goldMessage interpretation:
Thursday(4month6day),国际金价小幅回落,脱离隔夜创下的2022year3month9New high in recent days2031.97dollar/盎司。投资者等待即将公布的美国非农就业报告,以衡量美联储货币政策前景。
本周迄今,金价已上涨近2.4%。此前石油输出国组织及其合作伙伴(OPEC+)意外宣布新的减产,加上本周公布的美国经济数据普遍疲软,加剧了人们对经济放缓的担忧,并推动金价升至2000Above the US dollar.
本周已经公布的数据显示,美国服务业在3月份的放缓幅度超过预期,表明家庭正难以承受高通胀带来的负担。此外,3月份私营部门的新增就业岗位远低于预期。
投资者现在等待将在周五(4month7day)Published in the United States3月份非农就业报告。预计美国3Monthly increase in non agricultural employment population24万,相比1-2月份增势有所放缓,但仍高于趋势速度。失业率预计保持在3.6%不变,平均时薪预计从前值4.6%lower4.3%。
由于美联储提高利率,市场对经济衰退前景的担忧正在加深。根据CME的“联储观察”工具,市场认为美联储5月份维持利率不变的可能性为54.8%,并且最早从7Interest rates will begin to decrease in January.
克利夫兰联储主席梅斯特最新表态称,现在判断美联储是否需要在5月的政策会议上加息还为时过早。而她在本周稍早曾表示,美联储需要继续加息至5%上方,并维持利率在那里一段时间。
梅斯特和她的同事们正试图在不导致经济衰退的情况下将通胀率拉回到2%的目标。在3月份的政策会议上,大多数美联储决策者表示,预计需要继续加息至5.1%左右,并且在2024年之前不会降息。
FXStreetanalystDhwani Mehta发布报告称:“金价正回撤指向2000美元关口。若跌破该位,价格将挑战三角旗形阻力转支撑位1988美元。多头下一个关键防护为周二低点和三角旗形支撑的汇合处1975美元附近。若黄金多头回归,金价可能再度指向2020美元。之后多头将再度尝试挑战年度高点2032美元。金价必须升破后者才能再度上扬指向三角旗形目标位2043美元。不过在周五美国非农数据公布前,金价走势可能依旧震荡。”
Today's Gold Data:
13:45Switzerland3Unemployment rate after quarterly adjustment
14:00Germany2Monthly industrial output rate after quarterly adjustment
14:00britain3monthHalifaxMonthly rate of housing price index after quarterly adjustment
19:30U.S.A3Monthly Challenger Enterprise layoffs
20:30Canada3Monthly Employment Number
20:30From the United States to4month1Number of initial claims for unemployment benefits in the current week
22:00U.S.A3New York Fed Global Supply Chain Pressure Index
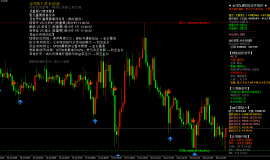
Technical analysis of gold:
Gold rose and fell yesterday, reaching its highest2032First line, lowest retreat to2010First line, closing at2020A relatively neutral position in the region, after such a trend, we can only judge that the strong bulls have slightly eased, without turning the trend, and the short term has shifted from strong to high volatility. The daily high level cross star appears in the high price range after continuous rise, which is a signal of turning from peak to trend. Currently, this peak signal still needs to be verified by actual trends, such as at least falling below2000Only through the level can we judge the top and strengthen it2030The effectiveness of this high point, reaching its peak, needs attention, but at least it can be judged that the trend is no longer strong today, and the daily level is weak and volatile. At present, the weekly level is still a bullish trend, but there are already shadow lines above, indicating the high weekly level in the early stageKBoth closed with hatches, twice2070The Week of the PassK,as well as3month2010High point weekKAll of them should be collected at least30The long shadow line of the knife, this weekKIt is also expected to receive a long shadow line, so gold can be bearish at that time1990/2000Region, while there will be non agricultural data tomorrow, but the market will be closed all day tomorrow. It is not ruled out that there will be panic selling in the market today, and gold will also weaken. Therefore, the weekly level is bearish on gold.
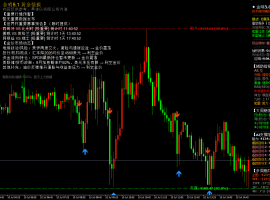
On a technical level, the daily chart shows that although the US dollar index rebounded strongly after Wednesday's announcement, the overall trend of gold prices remains relatively strong, as the market expects the Federal Reserve to suspend interest rate hikes and trigger safe haven buying. Gold is currently stable at2000The overall trend of the US dollar still tends to be bullish, despite being above the integer level,5Daily moving average and10The daily moving average crosses upwards and the upward momentum remains intact,KDas well asRSIThe indicators also continue to fluctuate upwards. However, the daily line closed with a cross star yesterday, and Bollinger showed signs of closing, indicating that the upward trend is not too strong, indicating that the upward space for gold may be limited and attention should be paid to the intraday decline2005-2000Support position.
4Hour chart Wednesday night high2032Fall back to2010Receive a big cross star, the short-term rise of gold is temporarily postponed, and it is now being tested10The moving average support, which is also from1976rebound2032Golden Section Withdrawal0.382Bit. At present, there are preliminary signs of a strong rebound in the US dollar index, as the market's risk aversion gradually cools down in the future.KDas well asRSIThe indicators are fluctuating downward, and the upward trend is gradually slowing down, indicating that gold is rising2032There is some pressure on the Bollinger Belt to go on the track, and there is a demand for correction in the short term of gold. The strength should be2000The checkpoint is stable, and if weak, it is not ruled out to step back1995-1990The Belt seeks support to stabilize and rise again, with a focus on the transformation of small cycle charts. The correction is also aimed at building momentum for bulls. Daily and4The hourly chart still tends to rise.1The previous high rise and low fall in the hour chart were at a lower position, driving the attached pictureMACDThe top of the indicator deviates. There are signs of a pullback in the small cycle chart. But the space needs to be determined by its form. Space can be large or small. Overall, today's gold short-term operation strategy is guided by the guidance of gold analysts, who suggest that the main focus is to rebound and short, supplemented by a pullback and long, with a focus on the short-term above2030-2032Frontline resistance, short-term focus below2008-2010Frontline support, friends must keep up with the rhythm.
4.6Reference for Golden Operation Strategy:
Empty order strategy:
Strategy 1: Gold rebounds2025-2028Short (buy down) 2/10 positions in batches nearby, stop loss6Points, target2015-2010Nearby, break down and take a look2005frontline; (Suggested for reference only, investment carries risks, and caution is required when entering the market!)
Multiple order strategy:
Strategy 2: Gold Callback2003-2005Nearby batch long (buy up) 2/10 positions, stop loss6Points, target2015-2020Nearby, break down and take a look2025frontline; (Suggested for reference only, investment carries risks, and caution is required when entering the market!)
|
"Small gifts, come to Huiyi to support me"
No one has offered a reward yet. Give me some support
|

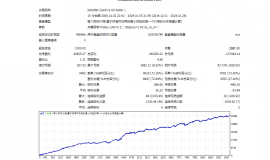
 【无敌黄金】一单一结
bookEAbyMT4平台专属现货黄金自动化交易程序,核心采用严格一单一结机制,同一时段仅持
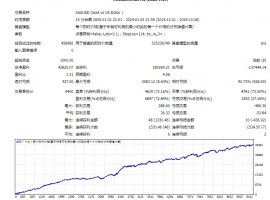
【无敌黄金】一单一结
bookEAbyMT4平台专属现货黄金自动化交易程序,核心采用严格一单一结机制,同一时段仅持
 7month10日午后黄金策略:金价回落至411
目前消息面对黄金还是偏压制。市场对美国利率继续维持高位、甚至进一步收紧的预期有
7month10日午后黄金策略:金价回落至411
目前消息面对黄金还是偏压制。市场对美国利率继续维持高位、甚至进一步收紧的预期有
 ZFX山海证券:金价惊险重返4100dollar
7month9日,国际黄金市场上演了一场惊心动魄的逆转大戏。在经历了连续三个交易日的下跌之
ZFX山海证券:金价惊险重返4100dollar
7month9日,国际黄金市场上演了一场惊心动魄的逆转大戏。在经历了连续三个交易日的下跌之
 ZFX山海证券:金价坚守4000Pass!
Wednesday(7month8日)现货黄金价格一度跌至4020美元附近,油价应声暴涨逾5%,刷新逾两周高点
ZFX山海证券:金价坚守4000Pass!
Wednesday(7month8日)现货黄金价格一度跌至4020美元附近,油价应声暴涨逾5%,刷新逾两周高点
 7month9日早上黄金策略:金价深V反弹后
昨晚黄金走了一波急跌,盘中一度逼近4020关口,随后展开深V反弹收复大部分跌幅,最
7month9日早上黄金策略:金价深V反弹后
昨晚黄金走了一波急跌,盘中一度逼近4020关口,随后展开深V反弹收复大部分跌幅,最


 Riser card
 Top card
 Silence card
 Color changing card
 lifting jack