Register now, make more friends, enjoy more functions, and let you play in the community easily.
You need Sign in Can be downloaded or viewed without an account?Register Now 
x
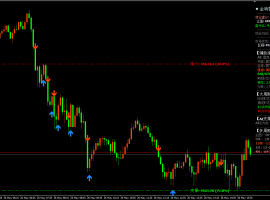
goldgoods in stock
Within the day: expect2009.00。
turning point:1956.00
Trading strategy:stay 1956.00 Above, bullish, target price is 1992.00 , and then 2009.00 。
Alternative strategies:stay 1956.00 Next, look short. The target price is set at 1945.00 , and then 1935.00。
Technical comments:RSIThe technical indicators are bullish and there is a further upward trend.

euro/dollar
Within the day: Upward trend.
turning point:1.0850
Trading strategy:stay 1.0850 Above, bullish, target price is 1.0950 , and then 1.0980 。
Alternative strategies:stay 1.0850 Next, look short. The target price is set at 1.0820 , and then 1.0790。
Technical comments:RSITechnical indicators show a further upward trend.

pound/dollar
Within the day: 新一轮上升。
turning point:1.2270
Trading strategy:stay 1.2270 Above, bullish, target price is 1.2335 , and then 1.2365 。
Alternative strategies:stay 1.2270 Next, look short. The target price is set at 1.2245 , and then 1.2220。
Technical comments:RSITechnical indicators show a further upward trend.

euro/Japanese yen
Within the day: Bullish.
Turning point:141.99
Trading strategy: bullish.
Alternative strategies: such as falling below 141.99 ,EUR/JPY Target orientation 141.35 and 140.97 。
Technical comments:RSITechnical indicators exceed50。 MACDTechnical indicators are above its signal line Be bearish. In addition, the price range is50Below the daily moving average ( 142.81 ) But higher than20Daily moving average ( 142.53 )。

euro/pound
Within the day: Bullish, when 0.8827 To support the position, the goal is set at0.8891。
Turning point:0.8827
Trading strategy: bullish, when 0.8827 To support the position, the goal is set at0.8891。
Alternative strategies: such as falling below 0.8827 ,EUR/GBP Target orientation 0.8804 and 0.8790 。
Technical comments:RSITechnical indicators greater than neutral areas50。 MACDTechnical indicators are below its signal line Look ahead. In addition, the price range is20Below the daily moving average ( 0.8851 ) But higher than its50Daily moving average ( 0.8823 )。

dollar/Swiss franc
Within the day: There is pressure.
turning point:0.9190
Trading strategy:stay 0.9190 Below, bearish, target price is 0.9120 , and then 0.9100 。
Alternative strategies:stay 0.9190 On the upside, the target price is set at 0.9210 , and then 0.9240。
Technical comments:RSIThe operating trend of technical indicators is complex and tends to decline.

GermanyDAXindexfutures (Eurex)
Within the day: Bearish 15522.00 Below.
Turning point:15522.00
Trading strategy: bearish 15522.00 Below.
Alternative strategy: such as breakthrough 15522 , GermanyDAXindex futures (Eurex) Target direction is 15707 and 15817 。
Technical comments:RSITechnical index is less than neutral area50。 MACDTechnical indicators are below its signal line Be bearish. In addition, the price is lower than its20Period and50Moving average of periods ( Located at 15409.25 and 15400.26 )。

Brentcrude oil (ICE) (K3)
Within the day: Scalping (Within the day)Supporting position74.70Near.
turning point:74.70
Trading strategy:stay 74.70 Above, bullish, target price is 77.10 , and then 78.10 。
Alternative strategies:stay 74.70 Next, look short. The target price is set at 73.90 , and then 72.90。
Technical comments:RSIThe operating trend of technical indicators is complex and tends to rise.

FTSE100index futures
Within the day: Bearish 7616.00 Is the resistance level.
Turning point:7616.00
交易策略:看跌,当 7616.00 Is the resistance level.
Alternative strategy: such as breakthrough 7616 , FTSE100index futures Target direction is 7695 and 7741.50 。
Technical comments:RSITechnical index is less than neutral area50。 MACDThe technical indicators are in a bullish state and Located below its signal line. In addition, the price is at its20Period and50Below the moving average for each period ( Currently 7550.73 and 7541.79 )。

Warm reminder: due to market fluctuations, the price may have crossed the key point, making the strategy invalid. This information comes fromTrading CentralAs a dissemination of market information, it does not contain and should not be deemed to contain investment opinions or investment suggestions or any trading behavior of offering or soliciting financial instruments, and is not a definitive prediction or guarantee for the future.
|
"Small gifts, come to Huiyi to support me"
No one has offered a reward yet. Give me some support
|

 ZFX山海证券:金价明显回调!
全球黄金市场在周二(5month26日)经历了一场明显的回调。现货黄金下跌1.38%Reported per ounce45
ZFX山海证券:金价明显回调!
全球黄金市场在周二(5month26日)经历了一场明显的回调。现货黄金下跌1.38%Reported per ounce45
 【5month27日】美伊“谈打”反复左右油
隔夜至今,黄金多头被两股力量反复拉扯——地缘层面的美伊谈判消息来回折腾油价,
【5month27日】美伊“谈打”反复左右油
隔夜至今,黄金多头被两股力量反复拉扯——地缘层面的美伊谈判消息来回折腾油价,
 2026-05-27 上午11:05 Gold price4506dollar
早上好,兄弟们。这会儿伦敦金报价刚好4506dollar/盎司,亚盘冲了一下没过去,4510upper
2026-05-27 上午11:05 Gold price4506dollar
早上好,兄弟们。这会儿伦敦金报价刚好4506dollar/盎司,亚盘冲了一下没过去,4510upper
 【5month26day 午后】黄金4533美元陷入窄
下午盘面没啥大动静,现货黄金报价4533dollar/盎司,一直在这附近晃悠。早盘冲了一波4
【5month26day 午后】黄金4533美元陷入窄
下午盘面没啥大动静,现货黄金报价4533dollar/盎司,一直在这附近晃悠。早盘冲了一波4
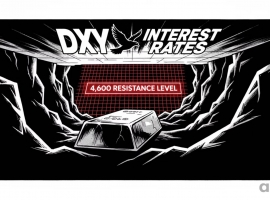 Aurra Markets:【黄金与利率走势】
为何黄金涨势受阻于 4600 Above USD ? 当前,黄金走势持续受到美国高利率环境的压制
Aurra Markets:【黄金与利率走势】
为何黄金涨势受阻于 4600 Above USD ? 当前,黄金走势持续受到美国高利率环境的压制


 Riser card
 Top card
 Silence card
 Color changing card
 lifting jack