Register now, make more friends, enjoy more functions, and let you play in the community easily.
You need Sign in Can be downloaded or viewed without an account?Register Now 
x
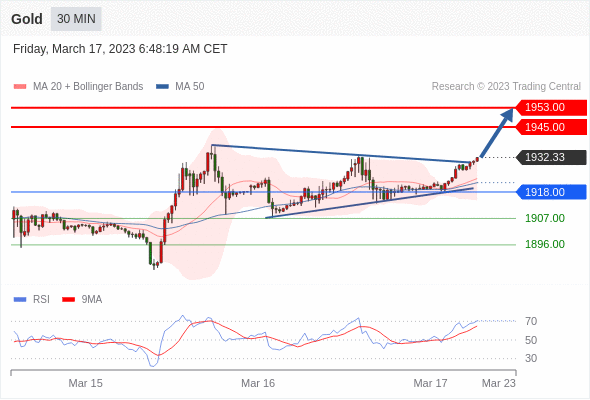
goldgoods in stock
Within the day: 新一轮上升。
turning point:1918.00
Trading strategy:stay 1918.00 Above, bullish, target price is 1945.00 , and then 1953.00 。
Alternative strategies:stay 1918.00 Next, look short. The target price is set at 1907.00 , and then 1896.00。
Technical comments:RSIThe technical indicators are bullish and there is a further upward trend.
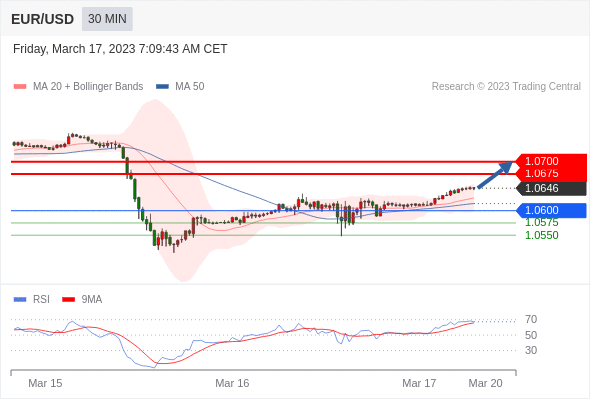
euro/dollar
Within the day: Further increase.
turning point:1.0600
Trading strategy:stay 1.0600 Above, bullish, target price is 1.0675 , and then 1.0700 。
Alternative strategies:stay 1.0600 Next, look short. The target price is set at 1.0575 , and then 1.0550。
Technical comments:RSIThe technical indicators are bullish and there is a further upward trend.
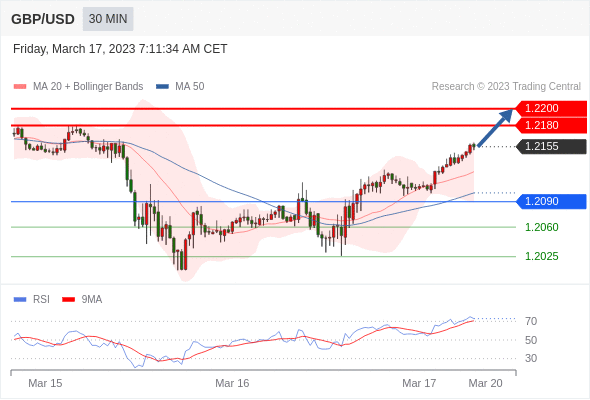
pound/dollar
Within the day: 新一轮上升。
turning point:1.2090
Trading strategy:stay 1.2090 Above, bullish, target price is 1.2180 , and then 1.2200 。
Alternative strategies:stay 1.2090 Next, look short. The target price is set at 1.2060 , and then 1.2025。
Technical comments:RSITechnical indicators show a further upward trend.
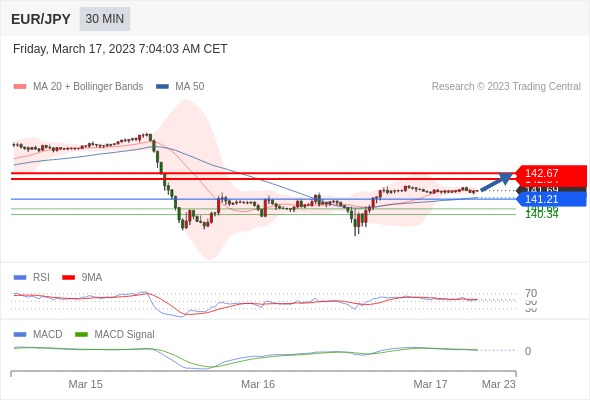
euro/Japanese yen
Within the day: Bullish, when 141.21 To support the position, the goal is set at142.67。
Turning point:141.21
Trading strategy: bullish, when 141.21 To support the position, the goal is set at142.67。
Alternative strategies: such as falling below 141.21 ,EUR/JPY Target orientation 140.66 and 140.34 。
Technical comments :RSITechnical indicators exceed50。 MACDTechnical indicators are below its signal line Look ahead. In addition, the price range is20Below the daily moving average ( 141.69 ) But higher than its50Daily moving average ( 141.29 )。
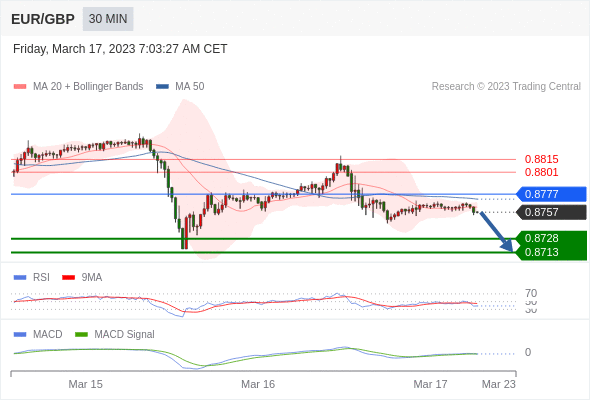
euro/pound
Within the day: Bearish 0.8777 Below.
Turning point:0.8777
Trading strategy: bearish 0.8777 Below.
Alternative strategy: such as breakthrough 0.8777 ,EUR/GBP Target direction is 0.8801 and 0.8815 。
Technical comments :RSITechnical indicators below50。 MACDThe technical indicators show a bearish state and Located below its signal line. In addition, the price is lower than its20Days and50Daily moving average ( Located at 0.8763 and 0.8772 )。 最后,价位跌破其布林线通道下轨 (be located 0.8757)。
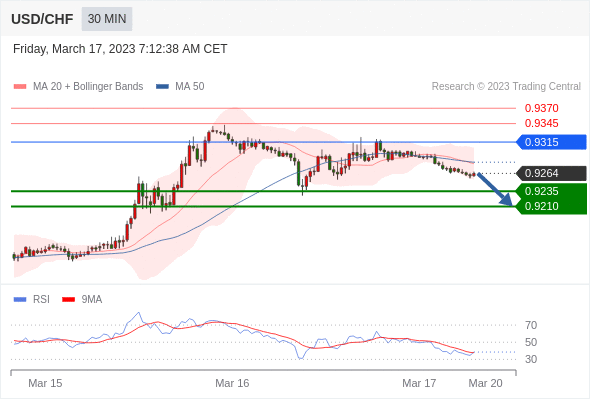
dollar/Swiss franc
Within the day: There is pressure.
turning point:0.9315
Trading strategy:stay 0.9315 Below, bearish, target price is 0.9235 , and then 0.9210 。
Alternative strategies:stay 0.9315 On the upside, the target price is set at 0.9345 , and then 0.9370。
Technical comments:RSITechnical indicators run downward.
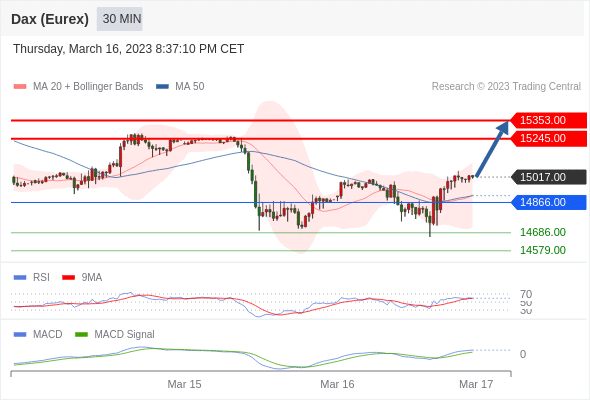
GermanyDAXindexfutures (Eurex)
Within the day: Bullish, when 14866.00 Is the support position.
Turning point:14866.00
Trading strategy: bullish, when 14866.00 Is the support position.
Alternative strategies: such as falling below 14866 , GermanyDAXindex futures (Eurex) Target orientation 14686 and 14579 。
Technical comments :RSITechnical indicators exceed50。 MACDThe technical indicators are in a bullish state and Above its signal line. In addition, the price is at its20Period and50Above the moving average for each period ( Currently 14909.50 and 14906.36 )。
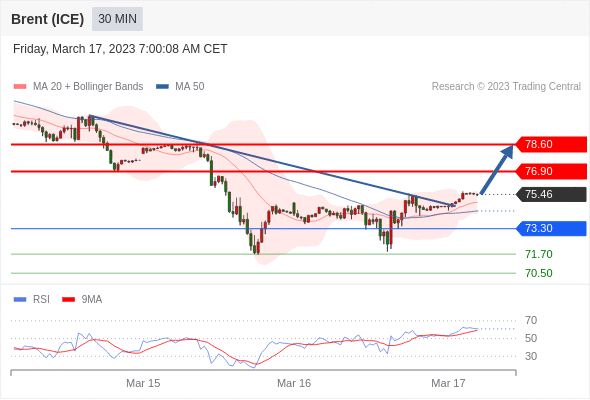
Brentcrude oil (ICE) (K3)
Within the day: 期待上涨。
turning point:73.30
Trading strategy:stay 73.30 Above, bullish, target price is 76.90 , and then 78.60 。
Alternative strategies:stay 73.30 Next, look short. The target price is set at 71.70 , and then 70.50。
Technical comments:RSIIn terms of technical indicators, there is an upward trend.
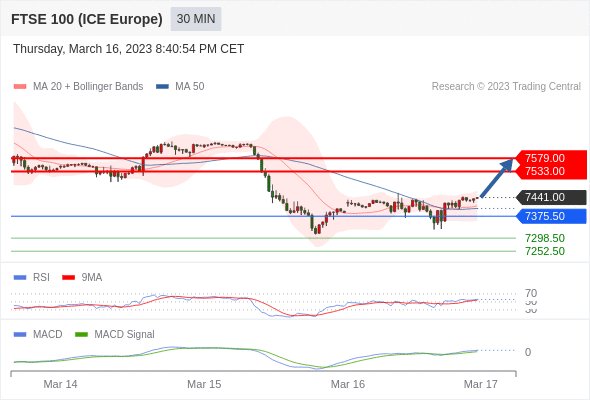
FTSE100index futures
Within the day: Bullish, when 7375.50 Is the support position.
Turning point:7375.50
Trading strategy: bullish, when 7375.50 Is the support position.
Alternative strategies: such as falling below 7375.50 , FTSE100index futures Target orientation 7298.50 and 7252.50 。
Technical comments :RSITechnical indicators greater than neutral areas50。 MACDThe technical indicators are in a bullish state and Above its signal line. In addition, the price is at its20Period and50Above the moving average for each period ( Currently 7411.55 and 7402.76 )。
Warm reminder: due to market fluctuations, the price may have crossed the key point, making the strategy invalid. This information comes fromTrading CentralAs a dissemination of market information, it does not contain and should not be deemed to contain investment opinions or investment suggestions or any trading behavior of offering or soliciting financial instruments, and is not a definitive prediction or guarantee for the future.
|
"Small gifts, come to Huiyi to support me"
No one has offered a reward yet. Give me some support
|