Register now, make more friends, enjoy more functions, and let you play in the community easily.
You need Sign in Can be downloaded or viewed without an account?Register Now 
x
goldgoods in stock
Within the day: stay1905.00Above, bullish.
turning point:1905.00
Trading strategy:stay 1905.00 Above, bullish, target price is 1924.00 , and then 1937.00 。
Alternative strategies:stay 1905.00 Next, look short. The target price is set at 1896.00 , and then 1886.00。
Technical comments:Even if we cannot rule out the possibility of continuous adjustment, its duration should be limited.

euro/dollar
Within the day: Short-term key resistance level1.0620。
turning point:1.0620
Trading strategy:stay 1.0620 Below, bearish, target price is 1.0565 , and then 1.0540 。
Alternative strategies:stay 1.0620 On the upside, the target price is set at 1.0650 , and then 1.0680。
Technical comments:The rising space may be1.0620Limited by resistance level.

pound/dollar
Within the day: Short-term key resistance level1.2090。
turning point:1.2090
Trading strategy:stay 1.2090 Below, bearish, target price is 1.2050 , and then 1.2030 。
Alternative strategies:stay 1.2090 On the upside, the target price is set at 1.2130 , and then 1.2165。
Technical comments:The rising space may be1.2090Limited by resistance level.

euro/Japanese yen
Within the day: The target price is set at 141.67 。
Turning point:140.07
Trading strategy: there is a possibility of rising, and the target price is set at 141.67 。
Alternative strategy: falling below 140.07 Will bring about a continued downward trend, with a target position of 139.53 And then for 139.21 。
Technical comments :RSITechnical indicators below50。 MACDThe technical indicators show a bearish state and Above its signal line. In addition, the price is lower than its20Days and50Daily moving average ( Located at 140.90 and 141.72 )。

euro/pound
Within the day: Bullish.
Turning point:0.8754
Trading strategy: bullish.
Alternative strategies: such as falling below 0.8754 ,EUR/GBP Target orientation 0.8730 and 0.8716 。
Technical comments :RSITechnical indicators exceed50。 MACDTechnical indicators are above its signal line Be bearish. In addition, the price is lower than its50Daily moving average ( 0.8784 ) But higher than its20Daily moving average ( 0.8772 )。

dollar/Swiss franc
Within the day: Bullish
turning point:0.9255
Trading strategy:stay 0.9255 Above, bullish, target price is 0.9345 , and then 0.9375 。
Alternative strategies:stay 0.9255 Next, look short. The target price is set at 0.9210 , and then 0.9165。
Technical comments:Even if we cannot rule out the possibility of continuous adjustment, its duration should be limited.

GermanyDAXindexfutures (Eurex)
Within the day: The target price is set at 15060.00 。
Turning point:14792.00
Trading strategy: there is a possibility of rising, and the target price is set at 15060.00 。
Alternative strategies: such as falling below 14792 , GermanyDAXindex futures (Eurex) Target orientation 14697 and 14640 。
Technical comments :RSITechnical index is less than neutral area50。 MACDThe technical indicators show a bearish state and Above its signal line. In addition, the price range is50Below the moving average for each period ( 15036.34 ) But higher than20Moving average of periods ( 14820.20 )。

Brentcrude oil (ICE) (K3)
Within the day: Short-term key resistance level75.25。
turning point:75.25
Trading strategy:stay 75.25 Below, bearish, target price is 72.80 , and then 71.70 。
Alternative strategies:stay 75.25 On the upside, the target price is set at 76.90 , and then 78.60。
Technical comments:As long as it still exists75.25There is a bearish trend in price fluctuations due to resistance levels.

FTSE100index futures
Within the day: The target price is set at 7435.00 。
Turning point:7369.50
Trading strategy: there is a possibility of rising, and the target price is set at 7435.00 。
Alternative strategy: falling below 7369.50 Will bring about a continued downward trend, with a target position of 7347 And then for 7333.50 。
Technical comments :RSITechnical index is less than neutral area50。 MACDThe technical indicators show a bearish state and Above its signal line. In addition, the price is lower than its50Moving average of periods ( 7515.37 ) But higher than its20Moving average of periods ( 7387.43 )。

Warm reminder: due to market fluctuations, the price may have crossed the key point, making the strategy invalid. This information comes fromTrading CentralAs a dissemination of market information, it does not contain and should not be deemed to contain investment opinions or investment suggestions or any trading behavior of offering or soliciting financial instruments, and is not a definitive prediction or guarantee for the future.
|
"Small gifts, come to Huiyi to support me"
No one has offered a reward yet. Give me some support
|

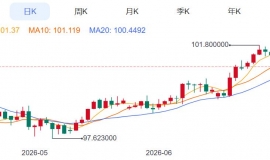
 ZFX山海证券:金价被油价大涨压制!
Tuesday(7month7日),油价大幅飙升,现货黄金当日下跌1.42%, receive reports per ounce4105美元,盘中一
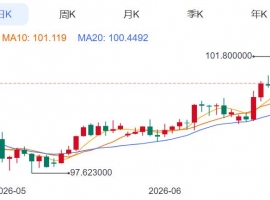
ZFX山海证券:金价被油价大涨压制!
Tuesday(7month7日),油价大幅飙升,现货黄金当日下跌1.42%, receive reports per ounce4105美元,盘中一
 ZFX山海证券:金价反弹受阻!
Monday(7month6日),现货黄金盘初一度冲至每盎司4202.09The US dollar, created by6month22日以来的两周新
ZFX山海证券:金价反弹受阻!
Monday(7month6日),现货黄金盘初一度冲至每盎司4202.09The US dollar, created by6month22日以来的两周新
 Aurra Markets:【美元走势分析】美
疲软就业报告将如何重塑市场格局?最新美国就业报告释放出劳动力市场降温信号,推动
Aurra Markets:【美元走势分析】美
疲软就业报告将如何重塑市场格局?最新美国就业报告释放出劳动力市场降温信号,推动
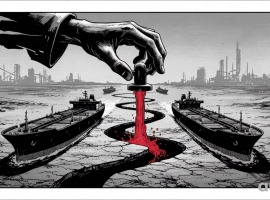 Aurra Markets:OPEC+ 提高产量,霍
OPEC+ 增产获批,将如何影响全球原油市场?O OPEC+正式批准进一步上调原油产量配额
Aurra Markets:OPEC+ 提高产量,霍
OPEC+ 增产获批,将如何影响全球原油市场?O OPEC+正式批准进一步上调原油产量配额
 钱塘论道,安全为基 | ZFX 山海证券
7 month 4 Day, by ZFX Organized by Shanhai Securities and Huiyou Post Station "2026 交易技术峰会・杭州站" 在美丽
钱塘论道,安全为基 | ZFX 山海证券
7 month 4 Day, by ZFX Organized by Shanhai Securities and Huiyou Post Station "2026 交易技术峰会・杭州站" 在美丽


 Riser card
 Top card
 Silence card
 Color changing card
 lifting jack