Register now, make more friends, enjoy more functions, and let you play in the community easily.
You need Sign in Can be downloaded or viewed without an account?Register Now 
x
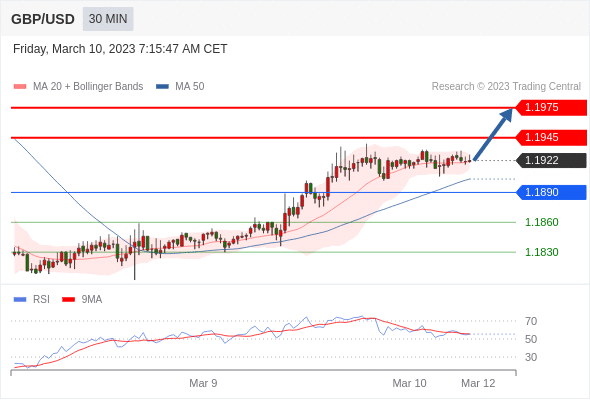
pound/dollar
Within the day: Upward trend.
turning point:1.1890
Trading strategy:stay 1.1890 Above, bullish, target price is 1.1945 , and then 1.1975 。
Alternative strategies:stay 1.1890 Next, look short. The target price is set at 1.1860 , and then 1.1830。
Technical comments:RSITechnical indicators run upward.
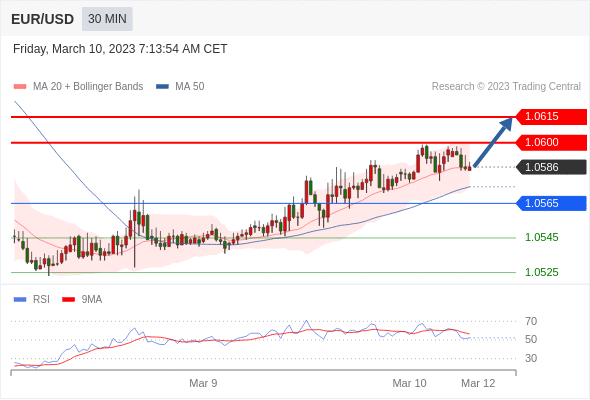
euro/dollar
Within the day: Upward trend.
turning point:1.0565
Trading strategy:stay 1.0565 Above, bullish, target price is 1.0600 , and then 1.0615 。
Alternative strategies:stay 1.0565 Next, look short. The target price is set at 1.0545 , and then 1.0525。
Technical comments:RSITechnical indicators run upward.
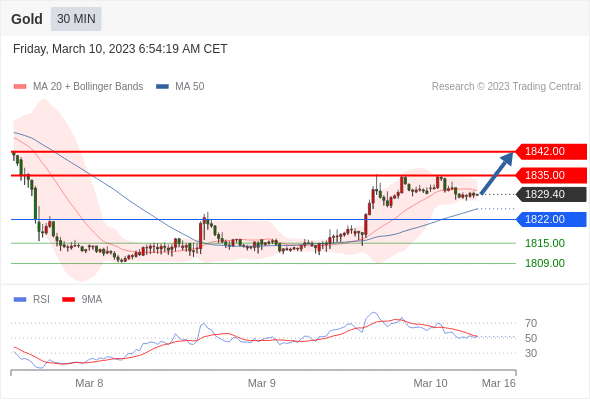
goldgoods in stock
Within the day: Bullish.
turning point:1822.00
Trading strategy:stay 1822.00 Above, bullish, target price is 1835.00 , and then 1842.00 。
Alternative strategies:stay 1822.00 Next, look short. The target price is set at 1815.00 , and then 1809.00。
Technical comments:RSIIn terms of technical indicators, it is bullish.
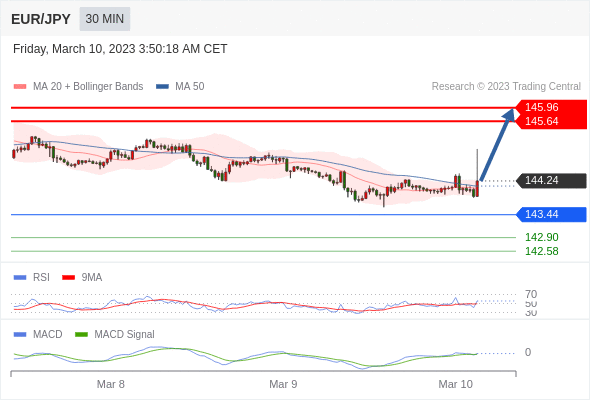
euro/Japanese yen
Within the day: Bullish, when 143.44 未被跌破。
Turning point:143.44
Trading strategy: bullish, when 143.44 未被跌破。
Alternative strategy: falling below 143.44 Will bring about a continued downward trend, with a target position of 142.90 And then for 142.58 。
Technical comments :RSITechnical indicators exceed50。 MACDTechnical indicators are above its signal line Be bearish. In addition, the price is higher than its20Days and50Daily moving average ( Located at 144.06 and 144.12 )。
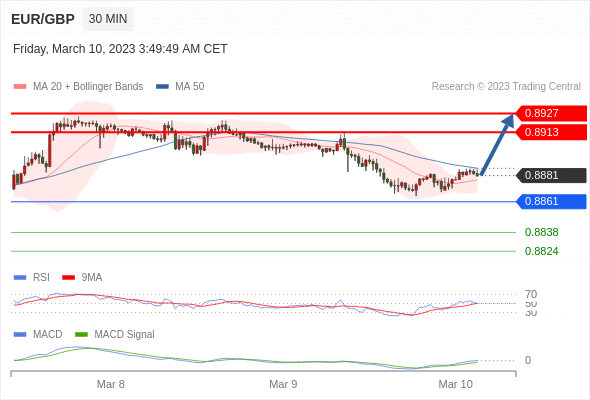
euro/pound
Within the day: The target price is set at 0.8927 。
Turning point:0.8861
Trading strategy: there is a possibility of rising, and the target price is set at 0.8927 。
Alternative strategy: falling below 0.8861 Will bring about a continued downward trend, with a target position of 0.8838 And then for 0.8824 。
Technical comments :RSITechnical index is less than neutral area50。 MACDTechnical indicators are above its signal line Be bearish. In addition, the price range is50Below the daily moving average ( 0.8886 ) But higher than20Daily moving average ( 0.8877 )。
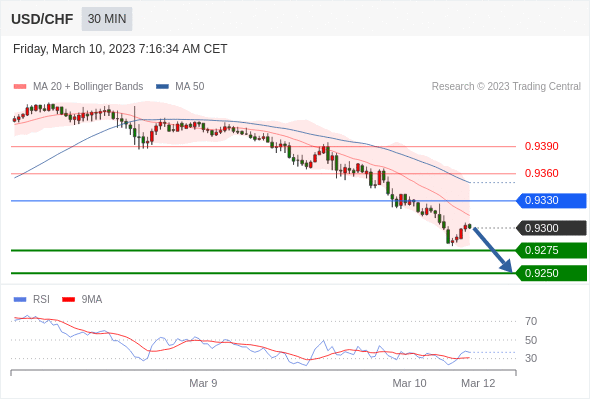
dollar/Swiss franc
Within the day: There is pressure.
turning point:0.9330
Trading strategy:stay 0.9330 Below, bearish, target price is 0.9275 , and then 0.9250 。
Alternative strategies:stay 0.9330 On the upside, the target price is set at 0.9360 , and then 0.9390。
Technical comments:RSIThe operating trend of technical indicators is complex and tends to decline.
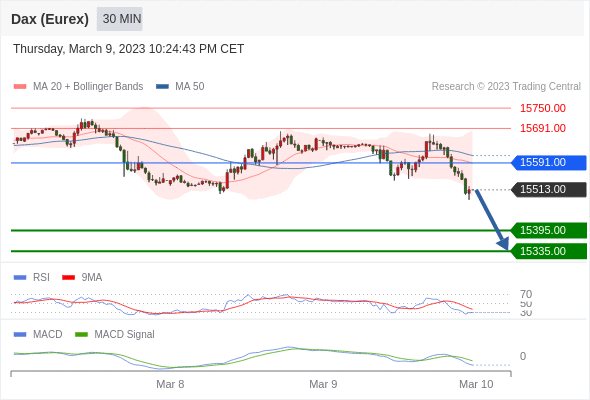
GermanyDAXindexfutures (Eurex)
Within the day: Bearish 15591.00 Below.
Turning point:15591.00
Trading strategy: bearish 15591.00 Below.
Alternative strategy: such as breakthrough 15591 , GermanyDAXindex futures (Eurex) Target direction is 15691 and 15750 。
Technical comments :RSITechnical indicators30之下,则可以看作有继续向下的趋势,或者处在一种超卖的状态下,很可能有技术性的反弹。 We can compareRSITo observe whether there is a technical deviation between the technical indicators and price trends. MACDTechnical indicators are below its signal line Be bearish. In addition, the price is at its20Period and50Below the moving average for each period ( Currently 15589.35 and 15612.36 )。
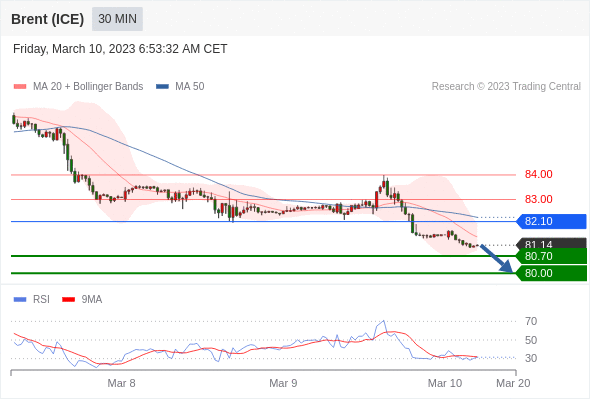
Brentcrude oil (ICE) (K3)
Within the day: There is pressure.
turning point:82.10
Trading strategy:stay 82.10 Below, bearish, target price is 80.70 , and then 80.00 。
Alternative strategies:stay 82.10 On the upside, the target price is set at 83.00 , and then 84.00。
Technical comments:RSITechnical indicators are bearish and there is room for further decline.
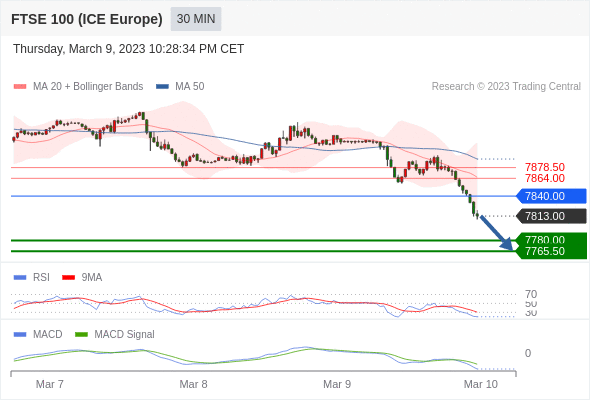
FTSE100index futures
Within the day: Bearish 7840.00 Below.
Turning point:7840.00
Trading strategy: bearish 7840.00 Below.
Alternative strategy: upward breakthrough 7840 , will bring about the trend of continuing to rise, and the target is set at 7864 and 7878.50 。
Technical comments :RSITechnical indicators less than30. In this case, it indicates a strong downward trend or indicates that there may be an upward rebound in a state of oversold. We will observeRSIWhether the technical indicators deviate. MACDThe technical indicators show a bearish state and Located below its signal line. In addition, the price is at its20Period and50Below the moving average for each period ( Currently 7865.43 and 7890.06 )。 Finally, the stock price is currently below the lower track of the Bollinger Line channel (be located 7818.37)。
Warm reminder: due to market fluctuations, the price may have crossed the key point, making the strategy invalid. This information comes fromTrading CentralAs a dissemination of market information, it does not contain and should not be deemed to contain investment opinions or investment suggestions or any trading behavior of offering or soliciting financial instruments, and is not a definitive prediction or guarantee for the future.
|
"Small gifts, come to Huiyi to support me"
No one has offered a reward yet. Give me some support
|