Register now, make more friends, enjoy more functions, and let you play in the community easily.
You need Sign in Can be downloaded or viewed without an account?Register Now 
x
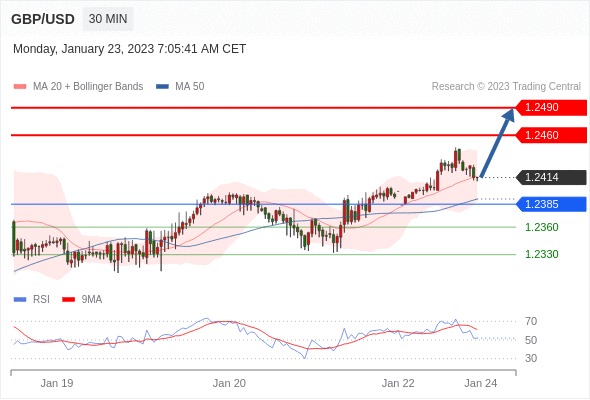
pound/dollar
Within the day: Upward trend.
turning point:1.2385
Trading strategy:
stay 1.2385 Above, bullish, target price is 1.2460 , and then 1.2490 。
Alternative strategies:
stay 1.2385 Next, look short. The target price is set at 1.2360 , and then 1.2330。
Technical comments:RSIThe operating trend of technical indicators is complex and tends to rise.
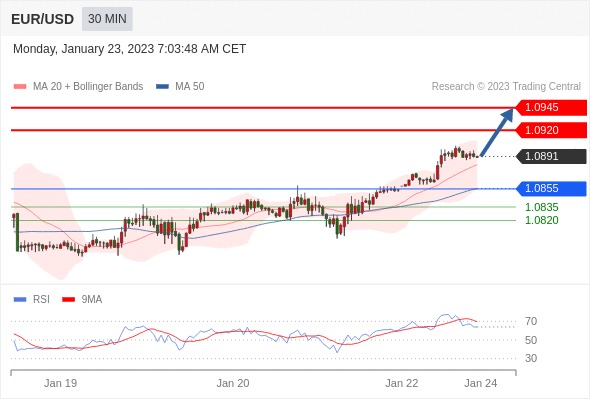
euro/dollar
Within the day: Bullish.
turning point:1.0855
Trading strategy:
stay 1.0855 Above, bullish, target price is 1.0920 , and then 1.0945 。
Alternative strategies:
stay 1.0855 Next, look short. The target price is set at 1.0835 , and then 1.0820。
Technical comments:RSITechnical indicators run upward.
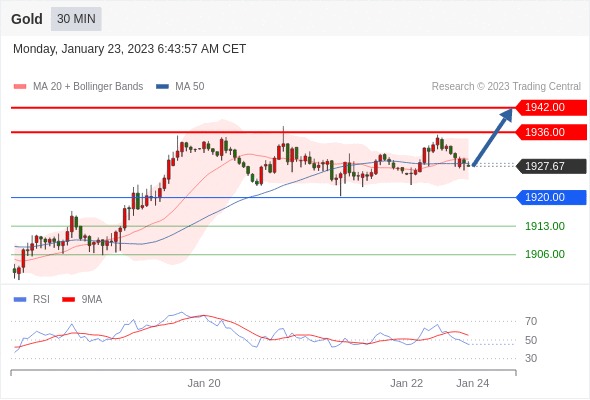
goldgoods in stock
Within the day: stay1920.00Above, bullish.
turning point:1920.00
Trading strategy:
stay 1920.00 Above, bullish, target price is 1936.00 , and then 1942.00 。
Alternative strategies:
stay 1920.00 Next, look short. The target price is set at 1913.00 , and then 1906.00。
Technical comments:Even if we cannot rule out the possibility of continuous adjustment, its duration should be limited.
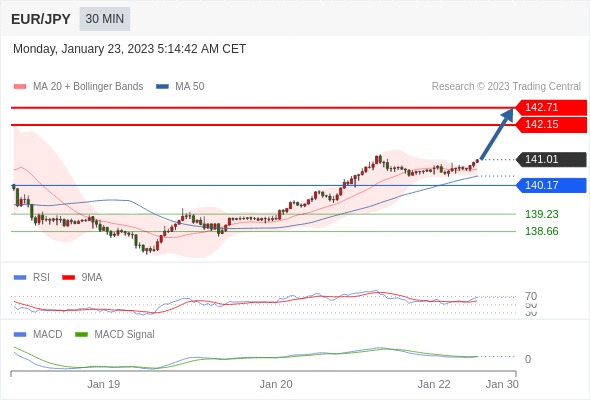
euro/Japanese yen
Within the day: Bullish, when 140.17 Is the support position.
Turning point:140.17
Trading strategy:
Bullish, when 140.17 Is the support position.
Alternative strategy:
If it falls below 140.17 ,EUR/JPY Target orientation 139.23 and 138.66 。
Technical comments :RSITechnical indicators exceed50。 MACDThe technical indicators are in a bullish state and Above its signal line. In addition, the price is at its20Days and50Above the daily moving average ( Currently 140.70 and 140.47 )。 最后,股价目前处在布林线通道上轨上方 (be located 140.95)。
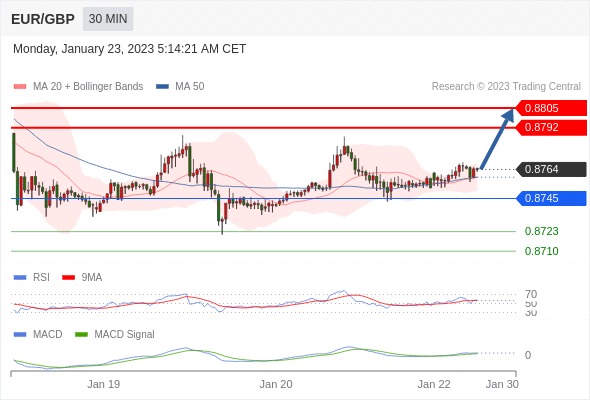
euro/pound
Within the day: Bullish, when 0.8745 Is the support position.
turning point:0.8745
Trading strategy:
Bullish, when 0.8745 Is the support position.
Alternative strategy:
Falling down and breaking through 0.8745 Will bring about a continued downward trend, with a target position of 0.8723 And then for 0.8710 。
Technical comments :RSITechnical indicators greater than neutral areas50。 MACDTechnical indicators are above its signal line Look ahead. In addition, the price is at its20Days and50Above the daily moving average ( Currently 0.8759 and 0.8759 )。
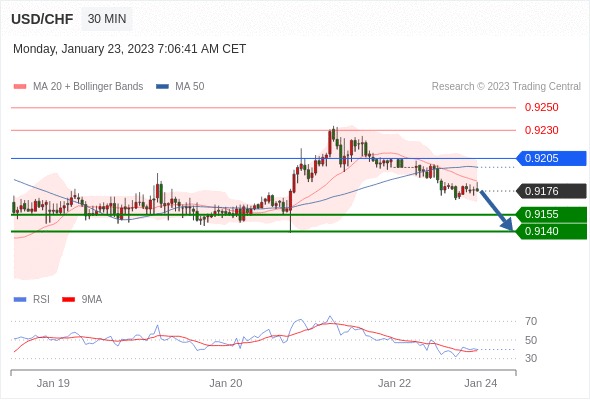
dollar/Swiss franc
Within the day: There is pressure.
turning point:0.9205
Trading strategy:
stay 0.9205 Below, bearish, target price is 0.9155 , and then 0.9140 。
Alternative strategies:
stay 0.9205 On the upside, the target price is set at 0.9230 , and then 0.9250。
Technical comments:RSITechnical indicators run downward.
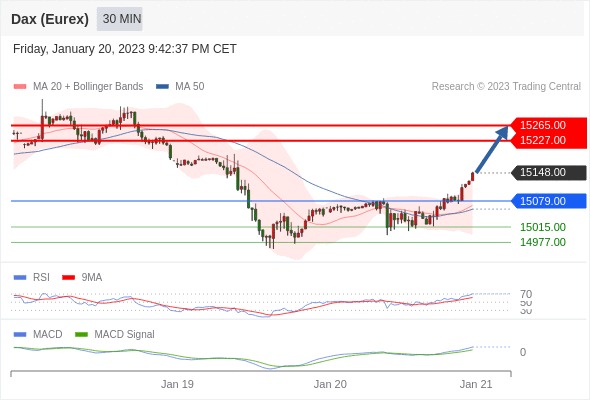
GermanyDAXindexfutures (Eurex)
Within the day: Bullish, when 15079.00 Is the support position.
Turning point:15079.00
Trading strategy:
Bullish, when 15079.00 Is the support position.
Alternative strategy:
If it falls below 15079 , GermanyDAXindex futures (Eurex) Target orientation 15015 and 14977 。
Technical comments :RSITechnical index is greater than70。 In this case, it indicates that there is a strong upward trend, or that there may be a downward adjustment in the overbought state. We will observeRSIWhether the technical indicators deviate. MACDTechnical indicators are above its signal line Look ahead. In addition, the price is higher than its20Period and50Moving average of periods ( Located at 15068.50 and 15059.02 )。 最后,股价目前处在布林线通道上轨上方 (be located 15142.46)。
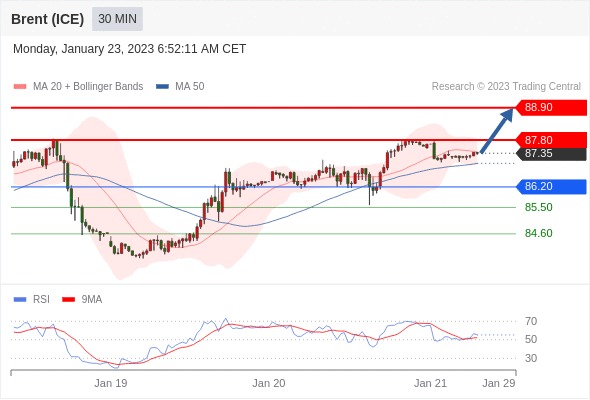
Brentcrude oil (ICE) (H3)
Within the day: towards88.90function.
turning point:86.20
Trading strategy:
stay 86.20 Above, bullish, target price is 87.80 , and then 88.90 。
Alternative strategies:
stay 86.20 Next, look short. The target price is set at 85.50 , and then 84.60。
Technical comments:RSITechnical indicators continue to rise.
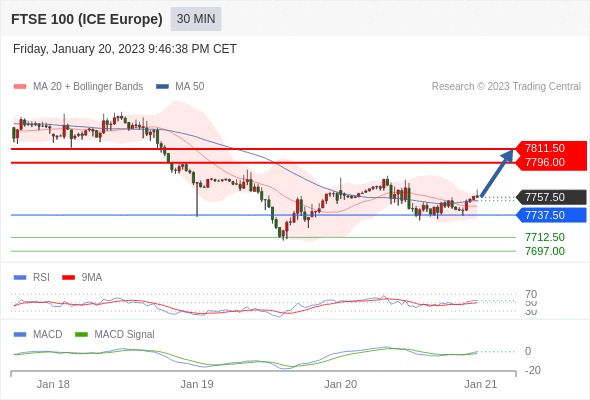
FTSE100index futures
Within the day: Bullish, when 7737.50 未被跌破。
Turning point:7737.50
Trading strategy:
Bullish, when 7737.50 未被跌破。
Alternative strategy:
Falling down and breaking through 7737.50 Will bring about a continued downward trend, with a target position of 7712.50 And then for 7697 。
Technical comments :RSITechnical indicators greater than neutral areas50。 MACDThe technical indicators show a bearish state and Above its signal line. In addition, the price is higher than its20Period and50Moving average of periods ( Located at 7747 and 7753.47 )。
|
"Small gifts, come to Huiyi to support me"
No one has offered a reward yet. Give me some support
|