Register now, make more friends, enjoy more functions, and let you play in the community easily.
You need Sign in Can be downloaded or viewed without an account?Register Now 
x
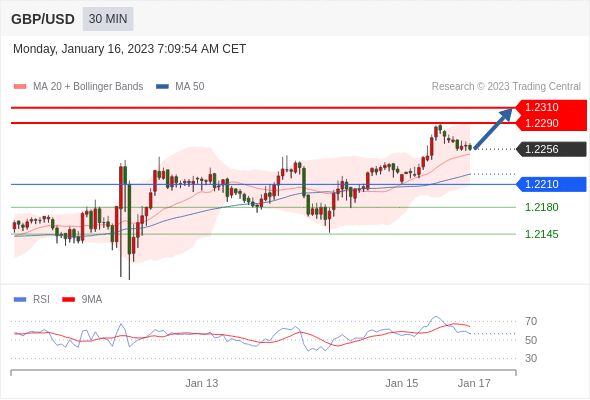
pound/dollar Within the day: Upward trend.
turning point:
1.2210
Trading strategy:
stay 1.2210 Above, bullish, target price is 1.2290 , and then 1.2310 。
Alternative strategies:
stay 1.2210 Next, look short. The target price is set at 1.2180 , and then 1.2145。
Technical comments:
RSIThe operating trend of technical indicators is complex and tends to rise.
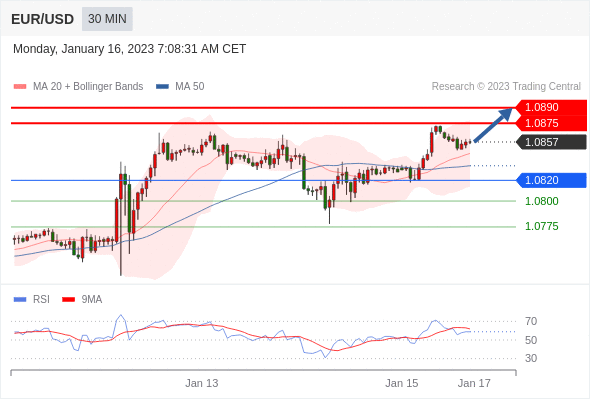
euro/dollar Within the day: Upward trend.
turning point:
1.0820
Trading strategy:
stay 1.0820 Above, bullish, target price is 1.0875 , and then 1.0890 。
Alternative strategies:
stay 1.0820 Next, look short. The target price is set at 1.0800 , and then 1.0775。
Technical comments:
RSIThe operating trend of technical indicators is complex and tends to rise.
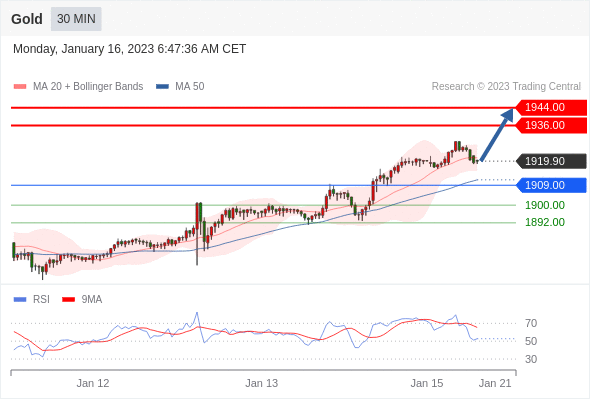
goldgoods in stock Within the day: stay1909.00Above, bullish.
turning point:
1909.00
Trading strategy:
stay 1909.00 Above, bullish, target price is 1936.00 , and then 1944.00 。
Alternative strategies:
stay 1909.00 Next, look short. The target price is set at 1900.00 , and then 1892.00。
Technical comments:
Even if we cannot rule out the possibility of continuous adjustment, its duration should be limited.
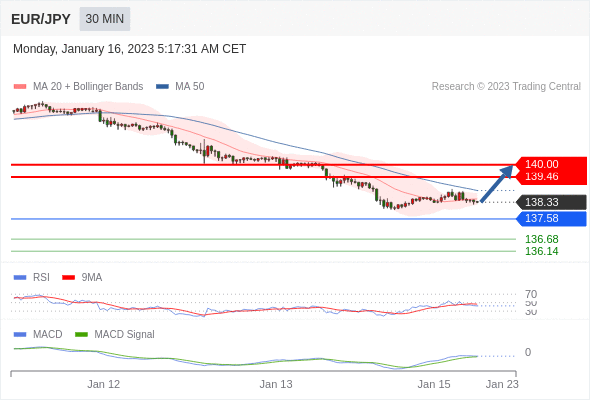
euro/Japanese yen Within the day: The target price is set at 140.00 。
The turning point is:
137.58
Trading strategy:
The target price is set at 140.00 。
Alternative strategy:
Falling down and breaking through 137.58 Will bring about a continued downward trend, with a target position of 136.68 And then for 136.14 。
Technical comments :
RSITechnical indicators below50。 MACDThe technical indicators show a bearish state and Above its signal line. In addition, the price is lower than its20Days and50Daily moving average ( Located at 138.47 and 138.85 )。
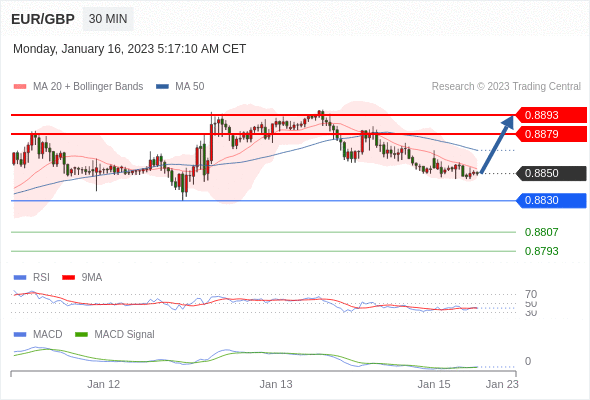
euro/pound Within the day: The target price is set at 0.8893 。
0.8830 作为转折点。
Trading strategy:
The target price is set at 0.8893 。
Alternative strategy:
If it falls below 0.8830 ,EUR/GBP Target orientation 0.8807 and 0.8793 。
Technical comments :
RSITechnical indicators below50。 MACDThe technical indicators show a bearish state and Above its signal line. In addition, the price is lower than its20Days and50Daily moving average ( Located at 0.8853 and 0.8867 )。
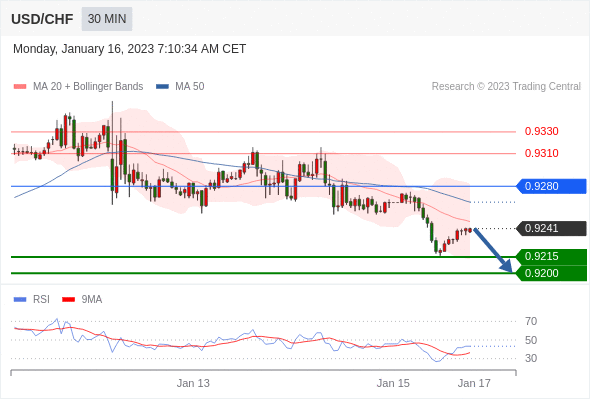
dollar/Swiss franc Within the day: There is pressure.
turning point:
0.9280
Trading strategy:
stay 0.9280 Below, bearish, target price is 0.9215 , and then 0.9200 。
Alternative strategies:
stay 0.9280 On the upside, the target price is set at 0.9310 , and then 0.9330。
Technical comments:
as long as0.9280The resistance level does not break through and falls down0.9215The risk of location is high.
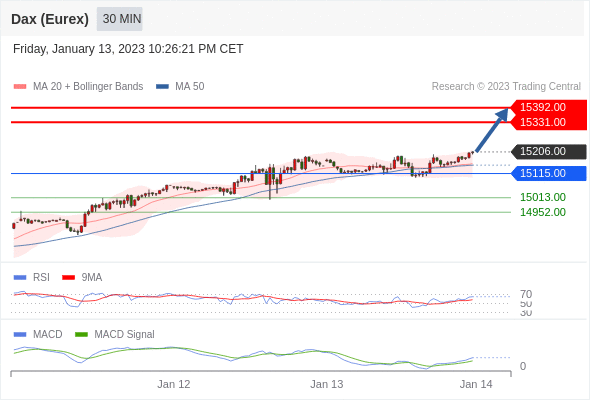
GermanyDAXindexfutures (Eurex) Within the day: Bullish, when 15115.00 Is the support position.
The turning point is set at:
15115.00
Trading strategy:
Bullish, when 15115.00 Is the support position.
Alternative strategy:
If it falls below 15115 , GermanyDAXindex futures (Eurex) Target orientation 15013 and 14952 。
Technical comments :
RSITechnical indicators greater than neutral areas50。 MACDTechnical indicators are above its signal line Look ahead. In addition, the price is higher than its20Period and50Moving average of periods ( Located at 15156.40 and 15150.26 )。
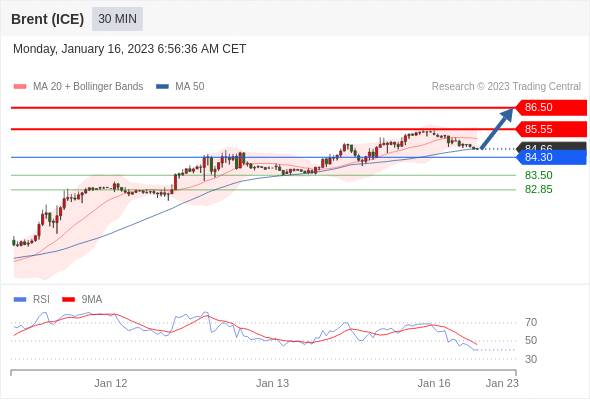
Brentcrude oil (ICE) (H3) Within the day: stay84.30Above, bullish.
turning point:
84.30
Trading strategy:
stay 84.30 Above, bullish, target price is 85.55 , and then 86.50 。
Alternative strategies:
stay 84.30 Next, look short. The target price is set at 83.50 , and then 82.85。
Technical comments:
Even if we cannot rule out the possibility of continuous adjustment, its duration should be limited.
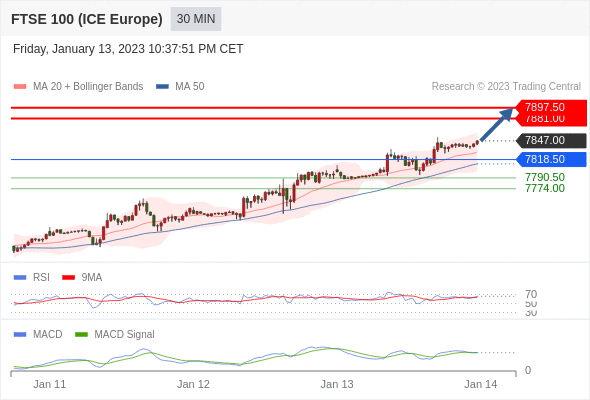
FTSE100index futures Within the day: Bullish, when 7818.50 To support the position, the goal is set at7897.50。
7818.50 作为转折点。
Trading strategy:
Bullish, when 7818.50 To support the position, the goal is set at7897.50。
Alternative strategy:
Falling down and breaking through 7818.50 Will bring about a continued downward trend, with a target position of 7790.50 And then for 7774 。
Technical comments :
RSITechnical indicators exceed50。 MACDThe technical indicators are in a bullish state and Located below its signal line. In addition, the price is higher than its20Period and50Moving average of periods ( Located at 7829.98 and 7811.95 )。
Kind reminder: Due to market fluctuations, prices may have crossed critical points, rendering the strategy ineffective.
|
"Small gifts, come to Huiyi to support me"
No one has offered a reward yet. Give me some support
|


