Register now, make more friends, enjoy more functions, and let you play in the community easily.
You need Sign in Can be downloaded or viewed without an account?Register Now 
x

According to wave theory, waves4Adjustment is often carried out in the mode of "time for space", and complex adjustment structures often appear at this stage, such as triangle, platform, joint, etc. wave4The adjustment depth of is often shallow, but it lasts a long time. wave4After the end, the market still runs in the same direction as the previous main trend. When the trend of a certain variety has obvious horizontal narrow amplitude shock, it can be regarded as a wave4And make a prediction: after the shock, the probability of continuing the previous trend is high.
The dollar index has shown these characteristics recently.12month6Day, closing price of the US Index105.56;12month14Day, closing price103.63。12month6So far, the market price of the US dollar index has not broken through the aforementioned upper and lower boundaries, with significant narrow range fluctuations. According to the conclusion of wave theory, there is a high probability that the US dollar index will continue to decline after the end of its volatility. in other words,103.63Will precede105.56Be broken through.
Other analytical methods also support this conclusion. averageMA60andMA120Poor downward performance means that bearish forces dominate;MA250The repeated entanglement with this month's market price means that the current volatility will continue for a longer time.MACDThe cylindrical line is located near the zero axis, while the fast slow line is below the zero axis, indicating signs of a downward shift in the center of gravity during short-term oscillations.
The Federal Reserve's tightening monetary policy will be1end of the month2The interest rate resolution at the beginning of the month will continue, and the rate hike is expected to narrow to25Base point. Although interest rate hikes will continue, the boosting effect on the US dollar index has disappeared. In fact, in the long run, the Federal Reserve may2023The interest rate reduction operation will begin in the second half of this year, as the current unfavorable factors of high inflation and high interest rates in the United States will lead to a recession in the US economy.

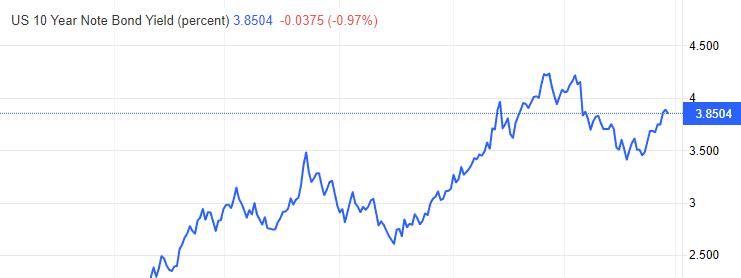
chart1Ten year US Treasury yield
The 10-year US Treasury yield performance was relatively abnormal.12month15So far, the yield has rebounded rapidly and has reached3.8485%。 Logically speaking, given that the Federal Reserve has already reduced the magnitude of a single rate hike and there is a long-term incentive to lower interest rates, the yield on 10-year US Treasury bonds should continue to decline. The abnormal performance of returns means that market funds are once again polarized towards the direction of the Federal Reserve's monetary policy, with some funds betting that the Federal Reserve will initiate aggressive interest rate hikes again next year.
An increase in bond yields will stimulate a strengthening of the US dollar index.12month15The US dollar index has been fluctuating in recent days, and the resonance between the two has not been well reflected. Considering that the stock of funds in the bond market is larger and its trend is more forward-looking, it is possible for the US dollar index to follow the rise of bond yields in the future.
ATFXAnalyst team's comprehensive view: From a technical perspective, it supports the continued decline of the US dollar index after the end of its volatility, while bond yields have given the opposite judgment. Considering that the current macroeconomic data in the United States does not support a continued increase in bond yields, the likelihood of a correct technical judgment is higher.
*Risk Tips and Disclaimers*
There are risks in the market and investment should be cautious. The above contents only represent the views of analysts and do not constitute any operational recommendations.
2022-12-29
|
"Small gifts, come to Huiyi to support me"
No one has offered a reward yet. Give me some support
|


