Register now, make more friends, enjoy more functions, and let you play in the community easily.
You need Sign in Can be downloaded or viewed without an account?Register Now 
x
goldMarket trend analysis;
Thursday(10month27During the Asian period in Japan, spot gold fluctuated and rose, briefly touching1670Pass, currently trading at1663.38dollar/Around ounces, the market expects the Federal Reserve to shift from12The month began to converge its aggressive stance on interest rate hikes,12Monthly interest rate hike only50The expected increase of one basis point has dragged the US dollar to a low of over a month, and US bond yields have also hit a new low of over a week, providing support for gold prices. The Bank of Canada only raised interest rates50The basis points provide evidence that central banks around the world are gradually slowing down their pace of interest rate hikes. Gold prices tend to be bullish in the short term, and the market still generally expects the Federal Reserve to11Monthly interest rate increase75One basis point. Gold is highly sensitive to rising US interest rates as it increases the opportunity cost of holding non yielding gold. Now the focus is turning to Thursday's US Gross Domestic Product(GDP)Data, followed by Friday's US core inflation(PCE)Data, these data may provide more clarity for the Federal Reserve's interest rate hike trajectory. Currently, market expectations for these two data are slightly bearish on gold prices, which may drag down the rebound speed of gold prices. Overall, although most central banks around the world will continue to raise interest rates further, causing concerns among bulls, various signs indicate that these central banks, especially the Federal Reserve, will slow down their pace of rate hikes. It is expected that12Monthly interest rate hikes only50Basis points, even25The yield of US dollars and US bonds dropped sharply, providing momentum for the gold price to rebound. Of course, investors should also pay attention to the USGDPData andPCEThe performance of data.
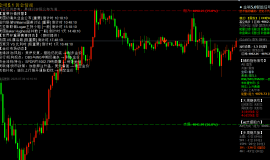
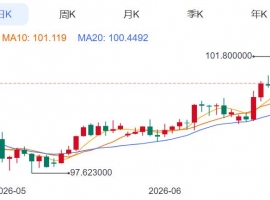
Technical analysis of gold; Gold continued to rise and close higher on Wednesday, holding onto its previous low point1640The upward rebound continues. After the weak downward trend of the US dollar broke through the neckline, it turned into an adjustment pattern. Boost gold prices out of a strong rebound, further pushing up to1674High point, although there was a pullback in the end, it still held on1660Above the close, yesterday's final harvest was a small bullish line, with further rebound on the daily chart. Combined with the weakness of the US dollar, gold will continue to rebound further in the short term. It's just that the rhythm is in a reversal bearish position, which may be accompanied by a step by step back approach. Locally forming a oscillatory rebound, maintaining a low pullback as the main idea, and combining spatial patterns while walking and observing.4Small scale rebound wave shape at the bottom1617Construct a wave of rebound, and1638As the rebound point of the second wave, it broke through yesterday1670The continuation of the wave shaped space is currently in the process of second wave rebound and extension,1638As a critical point for short-term bullish positions, it is currently expected to rise in the short term. Yesterday's late trading pullback1660Slightly stabilizing, while yesterday's low point was at1649.A bullish structure with a low point moving upwards and a high point moving upwards. At the same time, the consolidation will drive the moving average index to slowly turn upwards. short-term1638The upper part is mainly dominated by more. Cooperate with the high resistance point and then backhand short air.1In the hourly chart, there is a stepwise oscillation and upward trend, with a step-by-step consolidation and upward trend. Every time a new high is reached, it will be accompanied by a retracement. To follow this rhythm accurately, choose a lower timing during the process of stepping back. Overall, it is recommended to focus on short-term operations of gold today1675-1680Frontline resistance, short-term focus below1653-1648Frontline support.
crude oilMarket trend analysis;
10month27During the Asian trading session on Thursday, American Oil was trading at88.4dollar/Near the barrel; Oil prices surged near Wednesday4%Thanks to the record high crude oil exports from the United States, the net import volume of US crude oil has dropped to a record low, and the refining volume of US refineries is higher than the same period in previous years. The weakness of the US dollar has added support, and the recent strength of the US dollar has been a significant factor in suppressing the rise of the oil market. US Energy Information Agency(EIA)On Wednesday, it was announced that US crude oil inventories increased last week, despite record high export volumes.EIAAs of10month21During the current week, crude oil inventory increased260Ten thousand barrels, reaching4.399Billion barrels, almost predicted by analysts in a Reuters survey100Three times the increase of ten thousand barrels. Last week, crude oil exports surged to51010000 barrels/The record breaking daily level has led to a slight decrease in net crude oil imports, slightly higher than10010000 barrels/The daily level has also set a record. Since the Obama administration2015The year has ended for a long time40Since the oil export ban in, the United States has seen a significant increase in oil exports in recent years. Overall, the weakening of the US dollar and record high US crude oil exports support oil prices; The Russian military is conducting nuclear exercises, intensifying geopolitical tensions, and oil prices are expected to rebound in the short term supported by this90Gateway.
Technical analysis of crude oil; Crude oil volume broke through the early week range yesterday, hitting first and then rising, and hitting back first84.10After stabilizing on the first line, there is a potential breakthrough in the European and American market during the trading period87.0On track in the interval, up to88.10.And the closing price remained stable at the end of the day87.0Close above. The daily closing bullish line broke the continuous crossKLine consolidation, today's short-term trend will continue with inertia and further increase, 4The hourly chart rebounded after repeated downward explorations at the beginning of the week, holding on82.0-83.0Construct a platform based support to move upwards, currently breaking through the first resistance and forming a small-scale consolidation breakthrough. Today, the short-term trend will continue to rise, and the short-term moving average is also the first time a golden cross has turned upwards. Short term support within the day87.0Breakthrough conversion, support, take a bullish view first, target first90.0.Break down and look again92.0-93.0.It is also a spatial target point for the extension of upward rebound.1The hourly chart has seen a breakthrough in consecutive bullish gains, opening up the upper track of the Bollinger Bands, with support from the current mid track form. The middle rail support just moved upwards87.0Nearby, overlapping with the breakthrough point. The strong market trend is not going deep, and after the consolidation of the Asian market, it is expected to continue to rise further. Overall, it is recommended to focus on short-term operations for crude oil today90-91Frontline resistance, short-term focus below86-85Frontline support.
|
"Small gifts, come to Huiyi to support me"
No one has offered a reward yet. Give me some support
|

 ZFX山海证券:金价坚守4000Pass!
Wednesday(7month8日)现货黄金价格一度跌至4020美元附近,油价应声暴涨逾5%,刷新逾两周高点
ZFX山海证券:金价坚守4000Pass!
Wednesday(7month8日)现货黄金价格一度跌至4020美元附近,油价应声暴涨逾5%,刷新逾两周高点
 7month9日早上黄金策略:金价深V反弹后
昨晚黄金走了一波急跌,盘中一度逼近4020关口,随后展开深V反弹收复大部分跌幅,最
7month9日早上黄金策略:金价深V反弹后
昨晚黄金走了一波急跌,盘中一度逼近4020关口,随后展开深V反弹收复大部分跌幅,最
 ZFX山海证券:金价被油价大涨压制!
Tuesday(7month7日),油价大幅飙升,现货黄金当日下跌1.42%, receive reports per ounce4105美元,盘中一
ZFX山海证券:金价被油价大涨压制!
Tuesday(7month7日),油价大幅飙升,现货黄金当日下跌1.42%, receive reports per ounce4105美元,盘中一
 ZFX山海证券:金价反弹受阻!
Monday(7month6日),现货黄金盘初一度冲至每盎司4202.09The US dollar, created by6month22日以来的两周新
ZFX山海证券:金价反弹受阻!
Monday(7month6日),现货黄金盘初一度冲至每盎司4202.09The US dollar, created by6month22日以来的两周新
 Aurra Markets:【美元走势分析】美
疲软就业报告将如何重塑市场格局?最新美国就业报告释放出劳动力市场降温信号,推动
Aurra Markets:【美元走势分析】美
疲软就业报告将如何重塑市场格局?最新美国就业报告释放出劳动力市场降温信号,推动


 Riser card
 Top card
 Silence card
 Color changing card
 lifting jack