Register now, make more friends, enjoy more functions, and let you play in the community easily.
You need Sign in Can be downloaded or viewed without an account?Register Now 
x
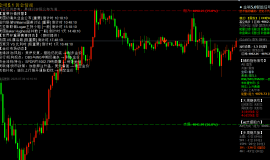
Last trading day Thursday(10month20day): Internationalgold/London's gold rose and fell slightly, ending slightly lower.
In terms of trend, gold prices have opened since the Asian market1629.35The US dollar briefly declined and reached an intraday low1622.37The US dollar then fluctuated and rebounded, continuing into the US market23Record intraday highs around midnight1645.23The US dollar eventually encountered resistance and fell, rapidly continuing to decline, taking back all its gains and touching at the end of the trading session1624The US dollar has stopped falling and fluctuated slightly, ultimately closing at1628.01USD, daily amplitude22.86USD, closing down1.34USD, decline0.08%。
In terms of impact, due to the weakening of the US dollar index, it recovered from the previous day's decline80%The gold price continued to rebound to the daily high, but after Truss said that she would resign as British Prime Minister, the pound turned from rising to falling in the volatile trading; Supporting the US dollar's bottoming out and recovery, and at the same time, this yearFOMCVoting committee and Federal Reserve Governor Cook stated that inflation in the United States is "still unacceptably high" and needs to continue raising interest rates and maintaining high levels that limit economic growth for a certain period of time in order to curb inflation. The hawkish rhetoric caused gold prices to fall back and close the line.
Looking Forward to Today Friday(10month21day)The international gold market showed a narrow and weak opening performance, while the US dollar index and US bond yields were relatively strong, exerting pressure on them; Overall, US Treasuries10The bullish trend of annual yield is obvious. Although the US dollar fell yesterday, it is still difficult to sustain gold prices. This is also what was mentioned yesterday. Even if gold rises, it is difficult to sustain and there is still a risk basis for a decline.
Overall, although the US dollar index has significant short-term downside potential, the overall trend is still upward. In addition, the technical bearish strength of gold prices is still relatively strong. Therefore, in the future, gold prices are expected to continue to decline and maintain the bearish pattern of weekly and monthly charts.
Five key data points to pay attention to during the day, please noteFOMCPermanent Voting Committee and New York Fed Chairman Williams delivered an opening speech at an event. Or cause some pressure on the gold price.
Fundamentally, overnight USD/JPY1990First breakthrough since150This symbolic level, technically speaking, shows a significant increase in bullish signals on the monthly and above cycles, indicating that there is still room for the US dollar to strengthen in the future. At the same time, although rising interest rates have cooled labor demand, the job market remains tense. The previous data showed that the number of initial jobless claims fell unexpectedly last week, which strengthened the expectation of the Federal Reserve's strong interest rate rise, and also made the yield of US treasury bond bonds continue to rise,
In addition, Philadelphia Fed Chairman Huck stated that despite high inflation levels, the Fed has not yet completed its task of raising short-term interest rate targets. The Federal Reserve is expected to raise interest rates to "much higher than" by the end of this year4%And continue to raise interest rates for a period of time. Other officials have also hinted that there will be more significant interest rate hikes this year, and there is currently little sign of a significant decline in inflation. Overall, gold prices will remain under pressure as expected until the end of the year and even the first quarter of next year. The bottom target below is still mainly based on the points shown in the monthly chart.
Technically, on the annual chart, it is still in the5The annual moving average supports the position, but the indicator signal also suggests a risk of falling below and touches the bullish trend support1421or1525Expectations near the US dollar, which is also due to2002The pullback in the upward trend starting from the beginning of the year supports the target, while also serving as an additional point for maintaining a long-term bullish trend. Therefore, bulls are bullish and need to continue waiting for the retreat target to be reached.
Monthly chart level, gold price in this year3Month and4In the form of two consecutive shooting stars hanging upside down and bearish, the month has successfully exited a sustained downward trend, continuing to the present day10In the month of the month, the downward trend pattern of a bottoming out rebound vertical line and following a rising and falling vertical line, with the low point also continuously moving downwards, has shown a downward trend. Therefore, it is expected that the market will continue to move,11The month will also further break new lows and maintain a downward trend.
I will also take a look directly below1600Below the US dollar, continue to covet100Monthly moving average support1446or1525The touch of the US dollar. From here, we can see the bottoming out and recovery. The probability of this expectation is still high.
Weekly level: The trend of gold prices remains stable3The downward trend of monthly decline, that is, every rebound will encounter obstacles10The weekly moving average has fallen and continued to hit its low point. Currently, gold prices continue to encounter obstacles10The weekly moving average is lower and running at200Weekly moving average and5Below the weekly moving average, this also reinforces this bearish view. Now, the bearish forces are exerting force, and the decline is further increasing. The probability of the future market will also continue to maintain this mode of decline, so we can wait for further declines. Below, we will focus on the low point of the previous bottoming rebound1614US dollar support, as well as the downtrend of the Bollinger Belt1600Support the target near the US dollar.
Unless the bulls rebound and stand firm10The weekly moving average, otherwise it will be difficult to break this viewpoint and the existing downward trend.
Daily level: Gold prices rose and fell yesterday, while bears still dominate, and the current trend continues to operate5Below the daily moving average, the bearish signal of the indicator has once again strengthened, and there are also many moving average resistance above the main chart. Therefore, the high-altitude strategy remains unchanged at present.
4At the hourly level, gold prices continue to experience resistance and fall back, with long upward shadow pressure, which puts pressure on performance. In addition, it also maintains this trend10The downward trend from the high point at the beginning of the month, therefore,1Although there is expectation and space for a rebound in the hour, once the rebound hits resistance, it can still be bearish.
Preliminary point reference for the day:
International Gold: Follow Above1633Resistance near the US dollar, and1640US dollar resistance; Follow Below1622USD support, and1616Support near the US dollar;
Spot silver: Follow from above18.90US dollar resistance, and19.20US dollar resistance; Follow Below18.40USD support, and18.24USD support;
|
"Small gifts, come to Huiyi to support me"
No one has offered a reward yet. Give me some support
|

 ZFX山海证券:金价坚守4000Pass!
Wednesday(7month8日)现货黄金价格一度跌至4020美元附近,油价应声暴涨逾5%,刷新逾两周高点
ZFX山海证券:金价坚守4000Pass!
Wednesday(7month8日)现货黄金价格一度跌至4020美元附近,油价应声暴涨逾5%,刷新逾两周高点
 7month9日早上黄金策略:金价深V反弹后
昨晚黄金走了一波急跌,盘中一度逼近4020关口,随后展开深V反弹收复大部分跌幅,最
7month9日早上黄金策略:金价深V反弹后
昨晚黄金走了一波急跌,盘中一度逼近4020关口,随后展开深V反弹收复大部分跌幅,最
 ZFX山海证券:金价被油价大涨压制!
Tuesday(7month7日),油价大幅飙升,现货黄金当日下跌1.42%, receive reports per ounce4105美元,盘中一
ZFX山海证券:金价被油价大涨压制!
Tuesday(7month7日),油价大幅飙升,现货黄金当日下跌1.42%, receive reports per ounce4105美元,盘中一
 ZFX山海证券:金价反弹受阻!
Monday(7month6日),现货黄金盘初一度冲至每盎司4202.09The US dollar, created by6month22日以来的两周新
ZFX山海证券:金价反弹受阻!
Monday(7month6日),现货黄金盘初一度冲至每盎司4202.09The US dollar, created by6month22日以来的两周新
 Aurra Markets:【美元走势分析】美
疲软就业报告将如何重塑市场格局?最新美国就业报告释放出劳动力市场降温信号,推动
Aurra Markets:【美元走势分析】美
疲软就业报告将如何重塑市场格局?最新美国就业报告释放出劳动力市场降温信号,推动


 Riser card
 Top card
 Silence card
 Color changing card
 lifting jack