Register now, make more friends, enjoy more functions, and let you play in the community easily.
You need Sign in Can be downloaded or viewed without an account?Register Now 
x
goldLatest market analysis:
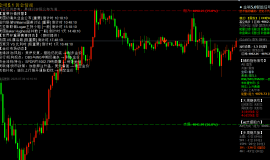
Technical analysis of gold: Gold rebounded further and closed positive on the daily chart yesterday, with a double positive streak. Yesterday was a breakthrough in the previous day's breakthrough volume, breaking through the previous day's breakthrough1739Short termAWave high points, forming small periodsABCThe waves rebounded and extended. Further rebound after breaking through for the first time yesterday is the norm. And the rebound space of the Asian disk is small, which is1733.80A stable start on the first line refers to the low point of the retest at the end of Wednesday evening. After two backpedals, hold on and further push up yesterday to1758High, once again breaking through the second highest point of the steps1752.Today's weekly closing work, due to the closing of the daily chart and the wave shaped space of small cycles, is expected to continue today.
Gold4The hour chart is currently inCAmidst the rebound of the waves,AWave low point1680Make a wave of rebound,BWave low point1711Make it a rising point, this level is the critical point for the bullish rebound, extending above this level and breaking through1752It's the second highest point, breaking the previous record4The weak decline at the hourly level has driven the gold cross upwards with the current moving average indicator,KThe short-term bullish trend in the line form, combined with the correction of the small bearish trend, is currently breaking through. However, the short-term trend is still relatively strong, and the space for retracement is slightly limited. For the small cycle form and small level bullish trend, horizontal consolidation is used instead of rebound. Combining the low point of the daily chart with the low point of the previous day1738-1736It is today's critical point, above which we will continue to be bullish in the short term, with a breakthrough point1748-1746Convert to support. Slightly retreat1750-1746Short term bullish trading can be done separately in different areas1765-1770。综上所述,今日黄金操作思路上建议回调做多为主,反弹做空为辅,上方短期关注1775-1780Frontline resistance, short-term focus below1752-1747Frontline support.
crude oilLatest market analysis:
Technical analysis of crude oil: crude oil hit a high and fell back yesterday, closing slightly negativeKThe line and daily line partially enter the Yin Yang cycle and do not have a clear unilateral pattern, indicating repeated detours and insufficient continuity. Yesterday's exploration high99.80.Breaking the high point at the beginning of the week98.90.But it did not stabilize and stepped back during the late trading period96.0Low position.4小时目前进入布林道区间收口,多空互有理由,看多是下方颈线未失,短线还有反弹摸高动能,看空则是目前处于构造双高的阶段。破位颈线形态方能成立。当然在破位之前,反复拉锯也是常态。目前短线布林道收口,下方颈线附近也多次起到支撑,今日周线收官,认为破位的机率不会太大,综合来看,原油今日操作思路上建议以回踩低多为主,反弹高空为辅,上方短期关注100.5-101.0Frontline resistance, short-term focus below96.5-96.0Frontline support.
|
"Small gifts, come to Huiyi to support me"
No one has offered a reward yet. Give me some support
|

 ZFX山海证券:金价坚守4000Pass!
Wednesday(7month8日)现货黄金价格一度跌至4020美元附近,油价应声暴涨逾5%,刷新逾两周高点
ZFX山海证券:金价坚守4000Pass!
Wednesday(7month8日)现货黄金价格一度跌至4020美元附近,油价应声暴涨逾5%,刷新逾两周高点
 7month9日早上黄金策略:金价深V反弹后
昨晚黄金走了一波急跌,盘中一度逼近4020关口,随后展开深V反弹收复大部分跌幅,最
7month9日早上黄金策略:金价深V反弹后
昨晚黄金走了一波急跌,盘中一度逼近4020关口,随后展开深V反弹收复大部分跌幅,最
 ZFX山海证券:金价被油价大涨压制!
Tuesday(7month7日),油价大幅飙升,现货黄金当日下跌1.42%, receive reports per ounce4105美元,盘中一
ZFX山海证券:金价被油价大涨压制!
Tuesday(7month7日),油价大幅飙升,现货黄金当日下跌1.42%, receive reports per ounce4105美元,盘中一
 ZFX山海证券:金价反弹受阻!
Monday(7month6日),现货黄金盘初一度冲至每盎司4202.09The US dollar, created by6month22日以来的两周新
ZFX山海证券:金价反弹受阻!
Monday(7month6日),现货黄金盘初一度冲至每盎司4202.09The US dollar, created by6month22日以来的两周新
 Aurra Markets:【美元走势分析】美
疲软就业报告将如何重塑市场格局?最新美国就业报告释放出劳动力市场降温信号,推动
Aurra Markets:【美元走势分析】美
疲软就业报告将如何重塑市场格局?最新美国就业报告释放出劳动力市场降温信号,推动


 Riser card
 Top card
 Silence card
 Color changing card
 lifting jack