Register now, make more friends, enjoy more functions, and let you play in the community easily.
You need Sign in Can be downloaded or viewed without an account?Register Now 
x
goldLatest Market Analysis
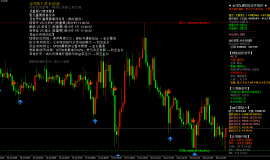
Technical analysis of gold: The gold daily chart recorded a longer shadow line and a smaller positive line, with a smaller positive line recorded in the past two trading daysKThe bottom range of the short line is narrow and organized, while the daily moving average shows a relatively regular downward divergence and a bearish arrangement. The consolidation of the low range of the short line will further exacerbate the technical indicator pattern of the bearish daily line. The hourly chart shows that the short-term low volatility of gold prices further intensifies the consolidation and narrowing pattern of the hourly chart. Currently, the gold price is forming a consolidation trend around the technical indicators of the hourly chart, and the short-term trend does not reflect a clear bullish or bearish direction reference, maintaining a slightly volatile trend. During the day, pay attention to the hour chart above and below the overall range1730The nearby support, if it falls below the decline of gold, will continue. And if the resistance of consolidation above1750If you are able to cross, be cautious of the impact of short covering on gold.
Gold is currently showing a clear downward trend, with the top1750The pressure is very obvious, and multiple attempts to break through the rebound have been unsuccessful! Although it rebounded on Friday, it fell back to its current range of fluctuations after encountering obstacles!4The hourly consecutive bearish decline hit a new low, with a slight pause last Friday and a partial contraction correction. The strength of the correction is determined by the rebound space. The rebound space is small, and horizontal consolidation correction is used instead of rebound, which belongs to the weak correction approach. The future market still looks to further decline, and it remains silent until a stop in the decline is formed. gold4On a hourly basis, it was still a bearish decline,kThe line remains running below the moving average and can now be seen4The hourly moving average has moved down to the consolidation pressure position,kThe intersection point between the line and the moving average is often the beginning of another decline in the band! Early market support1750The pressure rebounds and you can continue to short, break through the level1730Afterwards, it will fall to1700First line! In summary, it is recommended that today's gold trading strategy focus on rebounding at high altitudes, supplemented by a pullback at low levels, with short-term attention from above1750-1755Frontline resistance, short-term focus below1725-1720Frontline support.
crude oilLatest Market Analysis
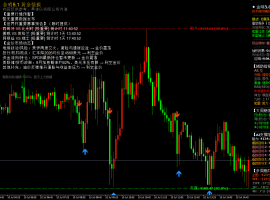
Technical analysis of crude oil: Crude oil initially suppressed and then rebounded last week. The weekly chart is bearish but has a longer upper shadow, approaching the low point of the neckline after falling back, and it is also the lower track of the weekly chart. Supported by the downward trend, it rebounded and closed higher, closing at104.0Nearby. The closing position was neutral, while the neckline remained unchanged. The weekly oscillation pattern has not changed and remains at a high level with a wide range of fluctuations. The future market93.0-95.0The neckline is a mid range long air defense. After the daily double yin dip, combined with the double yang rebound to recover, the unilateral strength in some areas is insufficient, with a mainly oscillating rhythm. crude oil4The hour formed a small-scale downward trend and rebounded, holding the low point and moving towards a second rebound to push it higher. There was a sustained upward trend in some areas, and some lost land was recovered, indicating that it still cannot move unilaterally in the short term.1The small steps in the hour chart oscillate and rebound, hold on101.50The low point has rebounded twice. At the beginning of the week, we continued to watch the seesaw oscillation, and the hourly chart tended to rise first and then fall. Continue the previous rebound and then seek resistance conversion to retrace. Overall, it is recommended that the short-term operation strategy for crude oil today should focus on a pullback with a lower bullish trend and a rebound with a higher bullish trend as a supplement, with a focus on short-term operations above105-106Frontline resistance, short-term focus below99-100Frontline support
|
"Small gifts, come to Huiyi to support me"
No one has offered a reward yet. Give me some support
|

 7month10日午后黄金策略:金价回落至411
目前消息面对黄金还是偏压制。市场对美国利率继续维持高位、甚至进一步收紧的预期有
7month10日午后黄金策略:金价回落至411
目前消息面对黄金还是偏压制。市场对美国利率继续维持高位、甚至进一步收紧的预期有
 ZFX山海证券:金价惊险重返4100dollar
7month9日,国际黄金市场上演了一场惊心动魄的逆转大戏。在经历了连续三个交易日的下跌之
ZFX山海证券:金价惊险重返4100dollar
7month9日,国际黄金市场上演了一场惊心动魄的逆转大戏。在经历了连续三个交易日的下跌之
 ZFX山海证券:金价坚守4000Pass!
Wednesday(7month8日)现货黄金价格一度跌至4020美元附近,油价应声暴涨逾5%,刷新逾两周高点
ZFX山海证券:金价坚守4000Pass!
Wednesday(7month8日)现货黄金价格一度跌至4020美元附近,油价应声暴涨逾5%,刷新逾两周高点
 7month9日早上黄金策略:金价深V反弹后
昨晚黄金走了一波急跌,盘中一度逼近4020关口,随后展开深V反弹收复大部分跌幅,最
7month9日早上黄金策略:金价深V反弹后
昨晚黄金走了一波急跌,盘中一度逼近4020关口,随后展开深V反弹收复大部分跌幅,最
 ZFX山海证券:金价被油价大涨压制!
Tuesday(7month7日),油价大幅飙升,现货黄金当日下跌1.42%, receive reports per ounce4105美元,盘中一
ZFX山海证券:金价被油价大涨压制!
Tuesday(7month7日),油价大幅飙升,现货黄金当日下跌1.42%, receive reports per ounce4105美元,盘中一


 Riser card
 Top card
 Silence card
 Color changing card
 lifting jack