Register now, make more friends, enjoy more functions, and let you play in the community easily.
You need Sign in Can be downloaded or viewed without an account?Register Now 
x
goldbarek盘面解读:
1小时周期亚盘开盘跳开1838后回落至中轨支撑附近后反弹,目前1小时周期形成了1826-1838缺口且局部于1840附近再次录得圆顶形态,后市整体看下行,根据缺口相关理论理论我们可知:缺口上口1838为短线阻力,下口1826为短线支撑,目前行情下破1小时周期的中轨,故美盘可依托1833一线顺势跟进空单。4小时周期头肩顶形态已成,且与1840阻力附近2根流星线,后市看下行。日线周期收阴构筑看跌吞没形态且处于20日均线之下,后市整体看下行。上方关注1844-1854短线阻力,上破看1860; Follow Below1816-1800短线支撑,下破看1780!
指标分析:
1、Maaverage:1Hourly cycleMa均线指向看涨,但目前行情已西坡20Daily moving average,Ma均线将再次趋于交叉粘合!
2、KDJIndicator:1Hour cycle and15Minute cycleKDJ交叉向上指向看跌,后市看下行;
3、RSIIndicator:1Hourly cycleRSI并未随行情新高而创新高,呈顶背离,后市可看下行!
综上:目前行情下破1Hourly cycle20日均线,美盘依托1833一线顺势跟进空单!
黄金波浪结构分析:行情震荡,整体波浪结构并未有实质性的改变,仍看3浪下行。
1、大一级别的波浪结构:由之前的分析我们可知,自1998起的行情,可视为C-3浪下行。行情再次破位1872一线,则之前划分的小5浪结构破坏(4浪不会进入2浪的价格区间),我们需对C-3浪的小浪结构重新进行划分。
2、C-3浪的细分:根据现有行情,笔者鼎盛金师认为可将1998-1786这一下行阶段视为C-3-1浪,如图中黄色线所示。依据现有走势,C-3-1浪已呈5浪结构走完,行情正处于C-3-2浪反弹之中!C-3-2的顶部可关注1892-1910这一区间,即1浪幅度的0.5-0.618区间,目前1小时周期整体构筑头肩顶形态后,再次构筑三山顶部形态,C-3-2浪于1878提前结束,后市看C-3-3浪下行。
Golden Strategy:
建议可于1833一线跟进空单,见1840Make up the position once and stop the loss1845, look at the goal1820-1800!破位中长空持有
crude oilTechnical analysis:
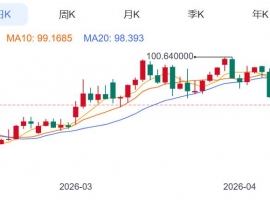
Crude oil fluctuated sideways last Friday, with a slight rebound in the European session. Currently, we are retesting106.5Nearby, but in the hourly chart structure, the short-term market is still within the triangular fluctuation range, and it is expected that106.5-107There is still a suppressive effect, but there is also a significant variable risk in the market after a sustained sideways trend. In the evening, Meiyou temporarily holds the expectation of adjusting under pressure, but the expectation should not be too large, and it is necessary to prevent the risk of market fluctuations. Please pay attention below103Nearby support testing, if the market falls back103.5Below, there is still a possibility for Meiyou to make a short-term comeback, and below, it may challenge this week's low point. But currently, Meiyou also has the conditions for an oversold rebound. If the market stabilizes107Above, then retest it110-111The area is also allowed.
The daily chart of crude oil has stagnated and fallen, and the current price is along theBOLLRunning down the track,KDThe indicator operates in the oversold area and is expected to have a high probability of rising and falling in the medium term; The hourly chart shows a low volatility situation, and the current price is still fluctuating and narrowing at a low level,KDThe golden cross of the indicator runs upwards, and it is expected that the probability of short-term fluctuations rising is relatively high. In terms of operational strategy, it is recommended to focus on low bullish, and pay attention below103.5一线支撑。综上所述总结:原油今日操作思路上鼎盛金师建议以回踩低多为主,反弹高空为辅,上方短期关注108.5-109.0Frontline resistance, short-term focus below105.0-104.5Frontline support.
writing/Ding Sheng Jin Shi, Contributor, Interpreting World Economic Highlights by Myself,Analyzing the Global Investment Trends,Has in-depth research on commodities such as crude oil, gold, silver, etc,Technical Director Dingsheng Jinshi provides online one-on-one real-time guidance due to network push latency,The above content is personal suggestion,Due to the timeliness of online publications,For reference only,At one's own risk,Please indicate the source for reprinting.!
|
"Small gifts, come to Huiyi to support me"
No one has offered a reward yet. Give me some support
|

 Aurra Markets:【WTI Analysis of crude oil trend
WTI原油:地缘政治引爆的突破行情? WTI原油价格已强势突破关键的 38.2% 斐波那契回
Aurra Markets:【WTI Analysis of crude oil trend
WTI原油:地缘政治引爆的突破行情? WTI原油价格已强势突破关键的 38.2% 斐波那契回
 Aurra Markets:受伊朗能源冲击,日
能源价格飙升之下,日本核心通胀为何持续走高? 在经历了 5 个月的平稳运行后,日本
Aurra Markets:受伊朗能源冲击,日
能源价格飙升之下,日本核心通胀为何持续走高? 在经历了 5 个月的平稳运行后,日本
 ZFX山海证券:金价跌至两周低位!
中东地缘局势持续动荡,国际油价持续上涨,打压美联储降息预期,美元指数走强,周四(
ZFX山海证券:金价跌至两周低位!
中东地缘局势持续动荡,国际油价持续上涨,打压美联储降息预期,美元指数走强,周四(
 ZFX山海证券:金价反弹受阻!
Spot Gold Wednesday(4month22日)反弹受阻。市场一度燃起乐观情绪,推动金价快速反弹至4772beautiful
ZFX山海证券:金价反弹受阻!
Spot Gold Wednesday(4month22日)反弹受阻。市场一度燃起乐观情绪,推动金价快速反弹至4772beautiful
 Aurra Markets:【黄金走势分析】空
黄金关键考验:更深层回调是否来临? Gold(XAU/USD)在经历短暂反弹后,当前再度
Aurra Markets:【黄金走势分析】空
黄金关键考验:更深层回调是否来临? Gold(XAU/USD)在经历短暂反弹后,当前再度


 Riser card
 Top card
 Silence card
 Color changing card
 lifting jack