Register now, make more friends, enjoy more functions, and let you play in the community easily.
You need Sign in Can be downloaded or viewed without an account?Register Now 
x
Acquaintance is fate, acquaintance is fate. I firmly believe that it is fate to meet for a thousand miles, and it is fate to wipe our shoulders without a share. The journey of investment is long, and temporary gains and losses are only the tip of the iceberg along the way. You should know that a wise man who has a thousand worries will have a loss, and a fool who has a thousand worries will have a gain. No matter how emotional you are, time will not stagnate due to you. Pick up the boredom in your heart and stand up again to pack up and move forward. At this moment, being able to read here indicates that you and I are destined. As long as you are willing to share your gains and losses with me, I will be happy to help you overcome difficulties and become your confidant on the investment journey. The stagnation of your heart makes you sit at the bottom of the well and sigh in the sky. Am I fortunate enough to accompany you as I pass by.
goldLatest trend analysis:
Technical aspect: From daily lineMACDIn terms of indicators, the bearish energy column has severely shrunk, and there are signs of bonding between the fast and slow lines, but there is no bullish kinetic energy yet,kThe line structure is also in a state of moving down from high to low points, so currently the daily line is only experiencing insufficient downward momentum, but there is no confirmation of a turning signal yet. There are two major possibilities for the daily line, one of which is to focus on1960The upper oscillation consumes the bearish momentum before breaking through and rising, and the second is to directly fall below1860Looking for new support, we are currently more inclined towards the second option, so friends who are considering arranging multiple bands need to be patient and wait.
Why is the focus on1860Instead of1850Although the daily line has reached its lowest point1850But the physical closing price is at1860Above, so if the daily line falls below this position, it will indicate1850The end of the rebound increases the probability of breaking a new low. The low point still follows what we said at the beginning of the month1826This position is the top and bottom transition point of the month line, and it is also a promising entry position for the mid month.
4When viewed online, the price of the Asian market directly breaks through1974First line, while prices are suppressed by the small cycle moving average,MACDAs seen above, the fast and slow lines have formed a dead cross and are in the0Below the axis, the opening of the Bollinger belt is flattening out, and the price is below the middle track. Gold4The hourly line is in a fluctuating and biased pattern. short-term1In terms of hours, it has been in a negative state today, and it has fallen below today1876Last Friday, the starting point for non farm stocks fell below this level, indicating that1865The rebound has ended,1Hour from1892A new downward band has been opened, and you can pay attention to the falling ones in the evening1876as well as1880Interval opening opportunities, pay attention below1850Gains and losses, short-term trend weakens, once it breaks down1860 , it is necessary to pay attention to breaking the1850The possibility of low points, with key resistance above1892If it can break through this position, the bottom rebound of the daily line is expected to be confirmed, and before the breakthrough, it can be operated around high altitude. Overall, it is recommended to focus on short selling with a rebound in gold trading tonight.
Golden Night Operation Strategy:
Strategy 1: Suggest a rebound in the market to1876-1878Short selling, stop loss1886, Objective1866-1862;
Strategy 2: Step back below1855Long nearby, stop loss1848, Objective1870-1878Near.
crude oilLatest market analysis:
From a technical perspective, crude oil fluctuates on a daily basis;MACDGolden fork,KDJGold fork, oil prices are currently testing the top resistance of the Bollinger Line track and the nearly one and a half month oscillation box. The moving average is arranged in long positions, and there is a high possibility of an upward breakthrough in oil price fluctuations. The initial resistance is at last week's high point111.7Nearby, then3month25Daily high point114.12Nearby resistance, strong resistance3month25Daily high point116.64Nearby. Preliminary support below5Daily moving average107.81Nearby, then10The daily moving average is supported by105.74Nearby, if the support is lost, increase the short-term bearish signal and strengthen the support21Daily moving average103.76Nearby. Looking at the daily chart,NYMEXThe price of crude oil is within the range of95.28The upward trend of the US dollar opening((3))Wave, upward resistance looking towards23.6%Target bit111.34USD. Looking at the hourly chart, the oil price is from100.28USD starts to rise(3)Wave trend, upward resistance looking towards100%Target bit112.94USD.(3)Waves are((3))The sub waves of the waves. Overall, Chen Zeqiang suggests that the short-term operation of crude oil today should focus mainly on rebounding from high altitude, supplemented by a pullback from low, with a focus on short-term operations above107.7-108.2Frontline resistance, short-term focus below104.0-103.5Frontline support. The article can only provide you with a temporary direction and ideas, as for the specific entry point settlement τ Please pay attention to the timing. Chen Zeqiang's firm offer will be provided in real time.
This article is exclusively authored by analyst Chen Zeqiang. I have always been passionate about the gold and crude oil markets. Due to the delay in online push, the above content is my personal suggestion. Due to the timeliness of online publishing, it is for reference only and at my own risk. Please indicate the source when reprinting
|
"Small gifts, come to Huiyi to support me"
No one has offered a reward yet. Give me some support
|

 哪个炒贵金属平台好,这5家正规平台
2026年,国际金价在多重利好因素的推动下持续走强,贵金属(现货黄金)作为全球公认的
哪个炒贵金属平台好,这5家正规平台
2026年,国际金价在多重利好因素的推动下持续走强,贵金属(现货黄金)作为全球公认的
 炒伦敦金赠金福利大搜罗:平台排名情
在全球经济波动加剧、地缘政治风险频发的背景下,伦敦金凭借其强劲的避险属性、高流动
炒伦敦金赠金福利大搜罗:平台排名情
在全球经济波动加剧、地缘政治风险频发的背景下,伦敦金凭借其强劲的避险属性、高流动
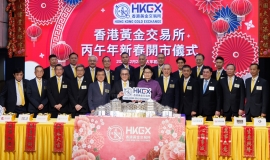
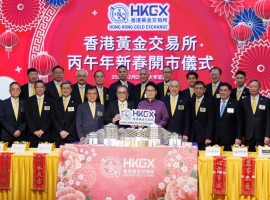 丙午开市新气象:金荣中国实物金银展
春启新程,金耀香江。北京时间2026year2month20日,香港黄金交易所(HKGK)丙午年马年新春
丙午开市新气象:金荣中国实物金银展
春启新程,金耀香江。北京时间2026year2month20日,香港黄金交易所(HKGK)丙午年马年新春
 正规现货白银投资平台哪个好?交易白
在贵金属投资领域,现货白银凭借其高流动性与避险属性,成为不少投资者资产配置的重要
正规现货白银投资平台哪个好?交易白
在贵金属投资领域,现货白银凭借其高流动性与避险属性,成为不少投资者资产配置的重要
 香港黄金市场迎政策东风,万洲金业助
马年新春,万象更新,香港黄金市场也迎来了前所未有的发展契机。香港财经事务及库务局
香港黄金市场迎政策东风,万洲金业助
马年新春,万象更新,香港黄金市场也迎来了前所未有的发展契机。香港财经事务及库务局


 Riser card
 Top card
 Silence card
 Color changing card
 lifting jack