Register now, make more friends, enjoy more functions, and let you play in the community easily.
You need Sign in Can be downloaded or viewed without an account?Register Now 
x
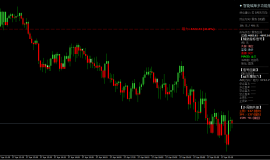
goldTechnical analysis:
黄金上周五非农相对而言较为平静,形成了一个区间性的震荡,在美盘尾部且最高触及到1891Starting to retreat from the vicinity is also a way for bears to clear their positions, while maintaining pressure on the upper levels is crucial1890In terms of the first line and the formation of a piercing action, it is likely that gold will continue to decline in the later stage, and a small retracement will be formed directly after the opening of the day. Therefore, the trend of the European market is relatively important. Once the European market forms a decline and breaks through the low, gold may continue to decline in the later stage, and the support below will be maintained in the short term1860If this position falls below the first line, the bearish target in the later stage will be maintained at1830Nearby, in the short term, gold is relatively in a bearish weak pattern, and the impact of non-agricultural activities has not affected the recent long short trend. More importantly, it has only repaired and adjusted the form. Currently, the pressure above gold remains at1880At the front line, we still need to short and wait below this position, so in short-term operations, Yang Zhenjin suggests rebounding and short selling as the main strategy, with gold rebounding within the day1878-77Short selling nearby, looking at the target1865-58Nearby, loss1882.5。
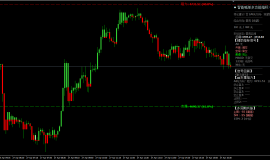
Analysis of silver trend:
Last week, the silver market opened at the beginning of the week22.703The market will first decline after the position is given22.088After its position, the market rose strongly and reached its highest point on the weekly chart23.277After the position of the market rose and fell, the weekly chart once again showed a low point and the market reorganized. The weekly chart finally closed at22.32After the position, the market closed with a long upper shadow and a bearish candlestick, and this pattern ended this week22.5Empty stop loss22.7Look at the target below22.05, break down and see21.8and21.5.
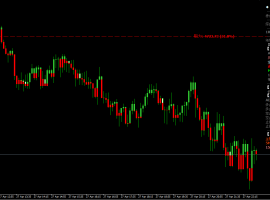
crude oilTechnical analysis:
Crude oil hit a high and closed higher last week, holding onto the weekly Bollinger Bands and rising again, reaching its highest point111.30During the late trading session last Friday, the market fell back and closed in one area110.30.This week, the gap opened low. The daily and weekly lines are still in a strong consolidation at high levels. Due to the fact that the low point of the neck line has not been breached for a long time, the downward space is limited, and some areas are in a high level oscillation tug of warKLine enters passivation and finishing.
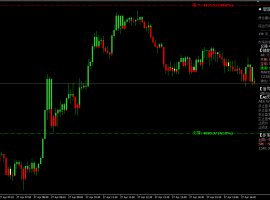
Crude oil4Hour chart second touch high pressure, in111.30Under pressure twice, the previous pressure was retested until106.50Stable start, pay attention to this low point this week. If the second pressure falls and breaks through the low, it will deepen the adjustment space and form a second high exploration and fall. Due toKThe line structure enters a tug of war cycle, resulting in insufficient persistence of long and short positions in form. There are reasons to be bullish and bearish, which is the stage of long short differentiation. In terms of operation, it is necessary to determine the direction by combining the transformation of the form with the steering wheel.1The hourly chart opens low and goes low, forming a secondary pressure, currently moving towards a low point106.5Approaching, the break will be further adjusted downwards. Overall, in terms of short-term trading strategy for crude oil today, it is recommended to focus on a pullback with a mostly low trend and a rebound with a high trend as a supplement. Short term attention should be paid to the above trend112.0-112.5Frontline resistance, short-term focus below107.9-107.4Frontline support.
|
"Small gifts, come to Huiyi to support me"
No one has offered a reward yet. Give me some support
|

 2026year4month27day22:48 金价震荡收窄,
根据晚间最新行情,现货黄金在美盘时段延续窄幅震荡,当前交投于4692dollar/Around ounces.
2026year4month27day22:48 金价震荡收窄,
根据晚间最新行情,现货黄金在美盘时段延续窄幅震荡,当前交投于4692dollar/Around ounces.
 2026year4month27day17:00 金价反弹遇阻,
根据午后市场行情,现货黄金自早盘低点(4672美元附近)反弹后,目前交投于4706dollar
2026year4month27day17:00 金价反弹遇阻,
根据午后市场行情,现货黄金自早盘低点(4672美元附近)反弹后,目前交投于4706dollar
 Aurra Markets:【英伟达走势分析】
英伟达的突破是牛市陷阱还是趋势延续? NVIDIA(NVDA)股价已飙升至历史新高,成功
Aurra Markets:【英伟达走势分析】
英伟达的突破是牛市陷阱还是趋势延续? NVIDIA(NVDA)股价已飙升至历史新高,成功
 Aurra Markets:美伊和谈陷僵局,布
是什么推动布伦特原油价格突破每桶 107 USD? 由于美国与伊朗之间的和平谈判陷入停
Aurra Markets:美伊和谈陷僵局,布
是什么推动布伦特原油价格突破每桶 107 USD? 由于美国与伊朗之间的和平谈判陷入停
 2026year4month27日黄金市场简报:多重利
核心消息面汇总:
[*]美联储鹰派定调:美联储理事沃什本周在参议院听证会明确"cautious
2026year4month27日黄金市场简报:多重利
核心消息面汇总:
[*]美联储鹰派定调:美联储理事沃什本周在参议院听证会明确"cautious


 Riser card
 Top card
 Silence card
 Color changing card
 lifting jack