"Small gifts, come to Huiyi to support me"
No one has offered a reward yet. Give me some support
| |
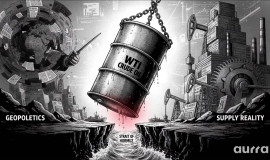
 Aurra Markets:【WTI Analysis of crude oil trend
WTI 原油:地缘政治风险溢价与供应基本面的博弈?WTI 原油市场当前正陷入一场拉锯战
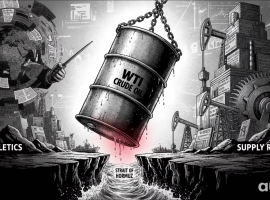
Aurra Markets:【WTI Analysis of crude oil trend
WTI 原油:地缘政治风险溢价与供应基本面的博弈?WTI 原油市场当前正陷入一场拉锯战
 Aurra Markets:降息预期延后,高通
降息步伐是否将比预期更晚到来?当前金融市场格局正处于不断变化之中,越来越多迹象
Aurra Markets:降息预期延后,高通
降息步伐是否将比预期更晚到来?当前金融市场格局正处于不断变化之中,越来越多迹象
 Aurra Markets 于阿布扎比金融博览会
阿联酋阿布扎比,2026 year 7 month 17 day —— 快速成长的多资产交易平台 Aurra Markets
Aurra Markets 于阿布扎比金融博览会
阿联酋阿布扎比,2026 year 7 month 17 day —— 快速成长的多资产交易平台 Aurra Markets
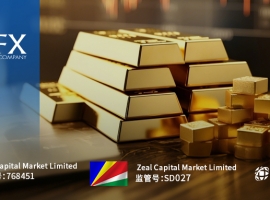 ZFX山海证券:金价暴跌2%Defeat4000shut
在全球地缘政治风云变幻的当下,黄金这一传统避险资产却罕见地遭遇重挫。2026year7month16
ZFX山海证券:金价暴跌2%Defeat4000shut
在全球地缘政治风云变幻的当下,黄金这一传统避险资产却罕见地遭遇重挫。2026year7month16
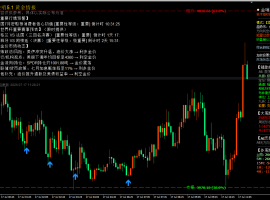 7month17日早上黄金策略:重返4000Gateway
消息面上,黄金昨日受到美元、美债收益率和油价上涨的压制,一度跌破4000USD barrier
7month17日早上黄金策略:重返4000Gateway
消息面上,黄金昨日受到美元、美债收益率和油价上涨的压制,一度跌破4000USD barrier
MIP|Mobile version|A small dark room| |Site Map |customer serviceQQ:2381682638
Copyright © 2006-2024 Huiyi Interaction https://www.forexbbs.net copyright All Rights Reserved.


 Riser card
 Top card
 Silence card
 Color changing card
 lifting jack