Register now, make more friends, enjoy more functions, and let you play in the community easily.
You need Sign in Can be downloaded or viewed without an account?Register Now 
x
The larger the fluctuation range, the more likely it is to attract the attention of traders. However, the higher the level of attention, the more likely the market is to experience reverse fluctuations. The philosophical explanation is that when most people discover opportunities, they no longer exist. Just like a peach tree full of fruits at the corner, when a large number of passersby discover it, soon there will be no peaches left on the tree. A common occurrence in the trading world is to see a smooth and significant unilateral decline/Rising and chasing orders, the market quickly entered a period of volatility. Based on this, traders must strive to become the first wave to discover peach trees at the corner, and the definition of a corner for the market is volatility. Spend more energy studying oscillations instead of focusing solely on trend trends. In a sense, a trend market is very simple. As long as it is formed, any indicator, structure, or data can capture it, but these all have a certain degree of delayed nature. The difficulty lies in discovering the signs that are forming before the trend appears.
The hook theory studies two consecutive opposite bands, such as the rising band+Downward band, or downward band+Upward band. Determine the strength and duration of the third wave of market development by comparing the relative positions of two bands and three key points. The hook structure in the trend market is very obvious, but the lag is very serious. So, we will focus on identifying hook shaped structures in volatile markets.

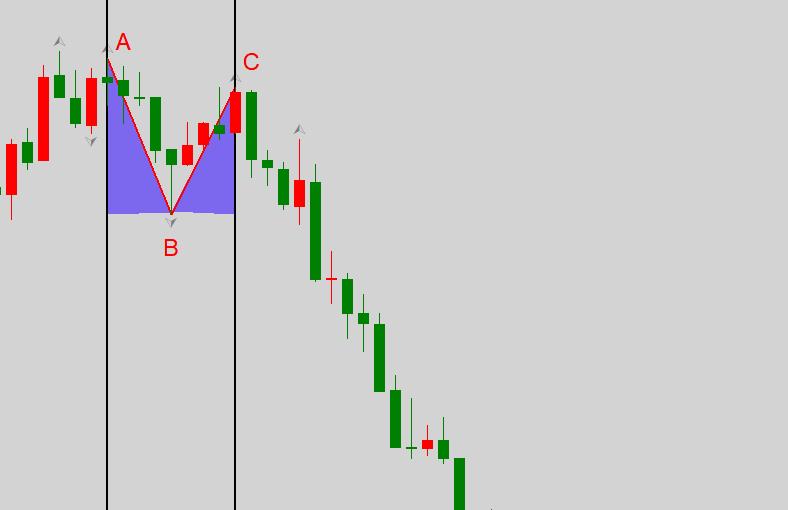
As shown in the figure,A-B-CThree points form a pullback hook shape, which consists of two bands, namely the downward bandA-BUpward bandB-C . Because it is in an oscillating rangeABandBCThe overall amplitude of the band is not too large, so it is called a small level hooked structure.CThe point must be betweenAPoint sumBBetween points, and closer to each otherBPoint, the higher the probability of success. The large-scale hook structure also follows this principle, because the smaller the rebound, the more powerful the downward trend is, and the higher the probability of the subsequent market trend continuing.
ABThe inclination angle andBCThe inclination angle (light blue area in the figure) should not be too small, in order to45The degree is appropriate. Of course,KThe angle in the line graph will change as the coordinate axis zooms in and out. Here, we provide45The degree standard is only a subjective standard, and in actual operation, traders need to review and understand it themselves. The angle is too small, indicating intense competition between long and short positions, and there is no consensus on who will have the upper hand. If the angle is too large, it indicates that the market development is mild, and the long and short main forces have not yet met, resulting in relatively small participation value.
Other requirements include:
1、ABbandKThe total number of lines is5Root left and right,BCbandKThe total number of lines is3Root up and down. Here5and3It is also a subjective number that is not fixed and needs to be handled according to the actual situation.
2Two bandsKThe lines and shadows should not be too long, as this means that the long and short game is not yet over.
3、5During short-term trading at the minute level,CExpected to be negative after the dotKLine. If there is a positive resultKLine, as long as the high point of the positive line is not taken by the next oneKJust break through the line.H4When trading with daily cycles, it is important to balance yin and yangKThe requirements of the line are no longer important, but rather based onCThe rate line of the downward band after the point is determined, as long as there is no significant change in the rate, it can be held for a long time.
4Only participate in the first wave of decline. If the first wave of decline ends and soon forms a pullback hook, it is not recommended to re-enter the market regardless of whether the structure is credible. From the perspective of Elliott's wave theory, the third type of buying and selling points that appear after the third wave is completed often have poor cost-effectiveness and are not necessary to participate.
Summary
The method of "effective breakthrough" can also be used to participate in volatile market trends, as long as the stop loss is appropriate, this method is also possible. For example, we can see in the diagramBAfter the point is broken through, entering the empty market can also achieve good returns. However, both the upper and lower limits of the oscillation range and the definition of effective breakthroughs need to be carefully considered.
Disclaimer:
1The above analysis only represents the analyst's perspective. There are risks in the foreign exchange market and investment needs to be cautious.
2、ATFXWe will not be responsible for any profit or loss that may arise from the direct or indirect use or reliance on this information.
|
"Small gifts, come to Huiyi to support me"
No one has offered a reward yet. Give me some support
|


