Register now, make more friends, enjoy more functions, and let you play in the community easily.
You need Sign in Can be downloaded or viewed without an account?Register Now 
x
goldLatest market analysis:
Golden News: Tuesday(4month27day)In the European market, global market risk sentiment was cautious, with most European and American stock markets under pressure, while European stock markets mainlystock market indexAll fell; In the foreign exchange market, the US dollar index surged and briefly broke through91Gateway, Euro/The US dollar fluctuates1.2080about; Spot gold hovers around1780Nearby. The analysis pointed out that the severe situation of the global COVID-19, especially the surge of newly confirmed cases in India, caused investors to worry about the confidence of economic recovery. At present, the market is focusing on Federal Reserve resolutions and Powell press conferences; President Biden's Joint Conference Speech, First Quarter of the United StatesGDPInitial valuePCEThe price index and other heavyweight events are bound to trigger a wave of drastic fluctuations!
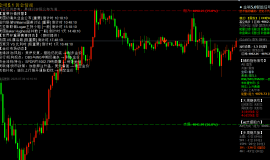
Technical analysis of gold: Tuesday(4month27In the Asian market, spot gold rebounded slightly1783Near it, it is under pressure again and falls back to1773Support area, in line with the operational strategy prediction provided by Li Xiaohan in the morning! From the perspective of market structure, the overall gold price is currently in a volatile and consolidation trend, and the gold price is temporarily at1770-1800Range fluctuation, which is likely a relay pattern, is expected to further lift and break through after the shock accumulates momentum1800At the checkpoint, then there is an accelerated upward trend.
In terms of technology, on the daily line, the long down shadow line and small positive line will be closed on Monday, and the overall trend of opening up and leveling out will be observed in the three tracks of the Bolin belt,KThe line temporarily runs between the upper and middle rails,MA5as well asMA10The bonding direction of the moving average is unknown,MACDDouble line upward operation,0The energy column above the axis has shrunk,KDJMoving downwards, the direction of the indicator is not obvious. Although gold prices have experienced a high decline, the overall trend of being bullish has not yet been broken.
Gold from4From the hourly chart, it can be seen that gold prices remain volatile, while the Bollinger belt pattern continues to show a narrowing trend, with a short-term moving averageEMA5andEMA10Walking flat without direction,MACDRun down,0The energy column below the axis has shrunk,KDJRunning upwards, there is no obvious direction for the indicator.4Hourly gold prices are under pressure in the early trading of the Asian market1783Fallback detection low1773There was a slight rebound and rebound in the vicinity, and if the gold price can further break through today1783-1785Regional resistance, expected to be retested upwards1790-1793Area and1795-1800Pressure. Still following below1770Pass support, this place will be tested again if it falls and stands firm1760-1759Regional support. Overall, Li Xiaohan suggests that the gold market should focus on a pullback and a long run, with a rebound in high altitude as a supplement, and short-term attention from above1790-1795Frontline resistance, short-term focus below1773-1768Frontline support. This article is written by Li Xiaohanlxhq281Please indicate the source when publishing and reprinting.
crude oilLatest market analysis:
Fundamentals Interpretation: Tuesday(4month27day)The oil price has slightly increased, and the market's attention will be focused on this week'sOPEC+At the meeting, due to uneven progress in the fight against the epidemic in various countries, analysts had varying opinions on the recovery of oil demand. howeverOPEC+The main risks faced by the oil market are the resolution, the possibility of a large-scale blockade by India, and the progress of negotiations on Iran's nuclear agreement.
Technical analysis: Yesterday, Meiyou suffered from pressure fluctuations and made a comeback, with a slight drop below it61Key support on the front line, but the market unexpectedly rebounded in the evening and returned to62Oscillating up and down, there is a long shadow line in the area where the daily line ends. The occurrence of such an abnormal trend is inseparable from the current market environment. The Indian epidemic has triggered concerns about crude oil demand, putting pressure on oil prices. Currently, the market is facing the problem of the OPEC meeting, and the market is clearly more looking forward to the OPEC meeting. Therefore, the short-term US oil trend also shows a tense competition state before major fundamental events. According to the daily structure, during the day, the top of the US oil company will pay attention to10Daily line and early highs62.4-6Pressure band, viewed as short-term strong pressure. Once this pressure is taken down, short-term oil companies may overcome the problem of weak fluctuations in technology. You can pay more attention to it from above64Nearby pressure. If we keep under pressure for the day62.4-6So there will still be further downward movements in the market, and the focus will still be on the following at that time61-60.7Once this position is lost, the US oil company's technology will open up a downward trend at the midline level. Overall, in terms of crude oil operations tonight, Li Xiaohan suggests a rebound and short selling as the main focus, supplemented by a pullback and a long low, with the top following63.5-64.0One line of resistance, pay attention below61.0-60.5Frontline support. This article is written by Li Xiaohanlxhq281Please indicate the source when publishing and reprinting.
|
"Small gifts, come to Huiyi to support me"
No one has offered a reward yet. Give me some support
|

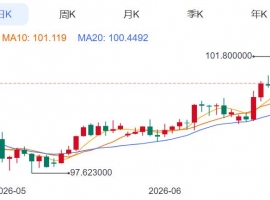
 ZFX山海证券:金价坚守4000Pass!
Wednesday(7month8日)现货黄金价格一度跌至4020美元附近,油价应声暴涨逾5%,刷新逾两周高点
ZFX山海证券:金价坚守4000Pass!
Wednesday(7month8日)现货黄金价格一度跌至4020美元附近,油价应声暴涨逾5%,刷新逾两周高点
 7month9日早上黄金策略:金价深V反弹后
昨晚黄金走了一波急跌,盘中一度逼近4020关口,随后展开深V反弹收复大部分跌幅,最
7month9日早上黄金策略:金价深V反弹后
昨晚黄金走了一波急跌,盘中一度逼近4020关口,随后展开深V反弹收复大部分跌幅,最
 ZFX山海证券:金价被油价大涨压制!
Tuesday(7month7日),油价大幅飙升,现货黄金当日下跌1.42%, receive reports per ounce4105美元,盘中一
ZFX山海证券:金价被油价大涨压制!
Tuesday(7month7日),油价大幅飙升,现货黄金当日下跌1.42%, receive reports per ounce4105美元,盘中一
 ZFX山海证券:金价反弹受阻!
Monday(7month6日),现货黄金盘初一度冲至每盎司4202.09The US dollar, created by6month22日以来的两周新
ZFX山海证券:金价反弹受阻!
Monday(7month6日),现货黄金盘初一度冲至每盎司4202.09The US dollar, created by6month22日以来的两周新
 Aurra Markets:【美元走势分析】美
疲软就业报告将如何重塑市场格局?最新美国就业报告释放出劳动力市场降温信号,推动
Aurra Markets:【美元走势分析】美
疲软就业报告将如何重塑市场格局?最新美国就业报告释放出劳动力市场降温信号,推动


 Riser card
 Top card
 Silence card
 Color changing card
 lifting jack