Register now, make more friends, enjoy more functions, and let you play in the community easily.
You need Sign in Can be downloaded or viewed without an account?Register Now 
x
goldMarket trend analysis
Message analysis: Friday(4month16Japan) Spot gold fell slightly. Although the US economic data was better than expected, the yield of US treasury bond bonds still fell, prompting investors to buy gold to hedge against possible inflation risks in the future. In addition, the sudden tension in US Russia relations has also stimulated some investors to seek safe haven. However, several major data releases have far exceeded market expectations, and the US stock market has reached a new historical high, which has limited the further rise of gold prices. The large-scale fiscal and monetary policy support from the United States, vaccine inoculation, and resilience demonstrated by households and businesses all indicate that the economy will accelerate growth in the second half of this year and continue to make progress, although progress may be uneven due to some industries recovering faster than others. The improvement of the US economy means that the US dollar may continue to strengthen, which will drag down the trend of gold prices.
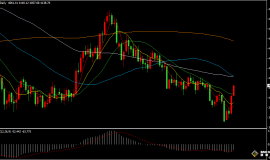
技术面:黄金日线收阳,从盘面来看,金价已经有效的形成突破,目前价格上涨从结构和形态上已经形成有效的趋势点位,强势的过程中价格会在很高的位置形成回落修正。交易者操作要注意这个点的形成,在形成趋势点的过程中,不要以为是价格反转,因为当下日图突破了箱体和趋势线,但是四维图表靠近了上线,收盘于上线下方,在突破中重点关注它的持续性,否则很难形成强有力的单边上行,但是趋势形成在未真正转势前尽可能的回落买入为主。从四小时图表来看,价格至破99The price after the antenna has fluctuated until yesterday's breakthrough, and the current upward trend is intact. The four-dimensional chart has broken through the upper line's acceleration line suppression. During the day, the focus is on the support of the upper line and the effective upward breakthrough of the speed line. However, there was a weak bearish signal in the early morning of the hourly chart, so we will not blindly chase long for the time being. Firstly, we will fall back more, and secondly, we will break through the acceleration line in four hours and cooperate with the second long turn of the hourly chart before buying. From the perspective of data quantification, support1756-48-42pressure1778-84-91In terms of operation, watching too much and not chasing too much will lead to a decline53-55Regional buying, the second is effective breakthrough70Based on a four hour closing time, draw back65-66Continue buying, see1778-84-91. Overall, the short-term operation strategy for today's gold market. Last week, Jinrui suggested a pullback and a long position as the main focus, supplemented by a rebound and short position. The top focus is on1760-1765Frontline resistance, short-term focus below1715-1720Frontline support. The market is constantly changing, with more real-time market analysis and timely operational strategies added.Author Zhou Jinrui(zjr8527)Daily market analysis, unwinding strategies, and guidance on medium to long term layout are all included.
GoldTDTrend analysis
GoldTDGold is present366Stabilizing and rebounding nearby, following the international gold market's volatile upward trend, breaking through370After the checkpoint, the bullish momentum expands, and the daily chart shows a medium bullish line with short-term pressure on the upper Bollinger Bands,MaAbove the moving average,MacdGold fork continues to increase volume, short-term gold is in a bullish pattern, four hours, gold breakthrough365-370The shaking box strengthens,KThe bullish trend of each indicator is maintained well, with consecutive positive lines,macdThe death cross has turned into a golden cross and the red bar has widened, indicating that gold is in a strong upward trend. It is recommended to retreat from the support level and place multiple orders in the short term. Suggestion to withdraw367/366Long, stop loss365.5, look at the goal374/375, hold against the limit.
SilverTDTrend analysis
SilverTDSilver has fallen and rebounded, with a daily chart showing a continuous bullish trend, and short-term pressure on the upper track,MaThe moving average has moved up,macdGold fork increases volume, red column expands, silver stabilizes5300After the market strengthens, it can be used as a dividing line to lay out multiple orders. In four hours, silver will break throughVThe rebounding neckline strengthens, and Bollinger opens his mouth upwards,Ma5Move up to5360Nearby, various indicators are arranged in multiple directions,macdGolden fork operation,KThe momentum of the head, shoulder, bottom, and right shoulder formed by the line continues to expand, and short-term silver is in a bullish and strong pattern, with buying mainly on dips in operations. Suggestion to withdraw5280/5260Long, stop loss5230, Objective5430/5450, take a break to see5500.
crude oilMarket trend analysis
Message analysis: Friday(4month16Crude oil prices in the United States have fluctuated, breaking through the trading range of the past month as there are more signs that the US is accelerating its rebound. New York crude oilfuturesAccompanied by a broader market rally, reaching a one month high. The number of first-time applications for unemployment benefits in the United States has fallen to a new low during the pandemic, and retail sales have grown at a rate of10The fastest recovery in the past month further proves the economic recovery. The positive results of the two major data in the United States indicate economic recovery, providing support for oil prices, and the severe relationship between the United States and Iran is also conducive to boosting oil prices. The increase in vaccination numbers and the easing of concerns about the epidemic provide a good opportunity for the market to steadily rise. howeverOPEC+Announce from5Starting from this month, gradually reducing production cuts may limit the potential for oil price increases, and relevant news still needs to be carefully monitored.
技术面:原油4On the hourly chart, yesterday remained stable62.5-63.5Repeated tug of war in the interval, although collecting a small bullish candlestick compared to the previous large bullish candlestick, the momentum is significantly weaker, belonging to the high-level consolidation pattern after the large bullish candlestick,KIn the absence of bearish fundamentals, crude oil tends to go long with a small pullback when viewed online. After all, crude oil currently has the upper hand in fundamentals, and the bullish trend in the basic form is also relatively strong. Focus on future pullbacks first62.2Frontline support, pay attention to whether there is a signal of building a top, and see if there is any upward trend between the low and high points. Suggestion: callback62.4-62.0Long, stop loss61.5, look at the goal63.2-63.5(Attention should be paid to the strength of momentum and bottoming signals before entering the market for a callback.). Overall, the short-term trading strategy for crude oil today was based on last week's personal recommendation from Jinrui, with a focus on low to long positions and high to medium positions as a supplement. Short term focus above65.0-65.5Frontline resistance, short-term focus below61.2-62.0Frontline support.
|
"Small gifts, come to Huiyi to support me"
No one has offered a reward yet. Give me some support
|

 Aurra Markets:【欧元兑美元走势预
欧元兑美元强势反弹:关键阻力位面临突破还是假突破?能源价格回落及美元走软,为欧
 Aurra Markets:10 月就业报告前瞻,
10 月就业报告有何值得关注的看点?定于周五公布的 10 月就业报告备受市场关注,预
 美国中期选举结果对黄金影响巨大!SI
this morning11.5国际现货黄金延续了前一日的强势,现货黄金盘中突破4100dollar/盎司,一度触及4
 Aurra Markets:铜价面临关键抉择,
铜价是否预示全球经济格局正在转向?当前,铜价正处于关键十字路口,短期经济逆风与
 Aurra Markets:美国民主党与国会:
民主党掌控国会将如何影响您的财务状况?近期美国选举带来了美国政坛的重大变化,民






 Riser card
 Top card
 Silence card
 Color changing card
 lifting jack