Register now, make more friends, enjoy more functions, and let you play in the community easily.
You need Sign in Can be downloaded or viewed without an account?Register Now

x

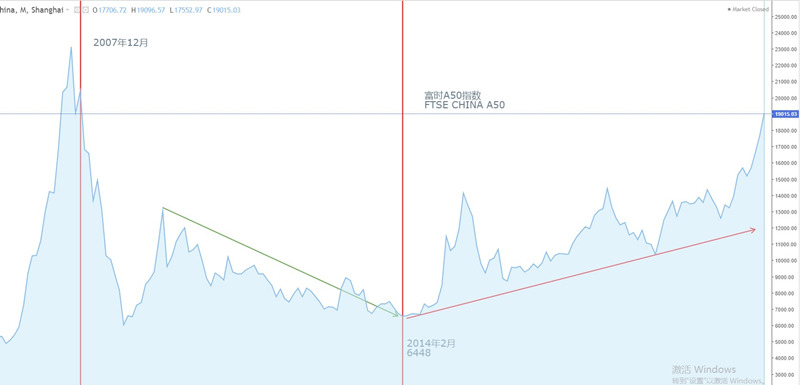
chart1,FTSE China A50 Lunar line
Firstly, it should be noted that,MT4Among them, FushiA50Code isCHI50Commonly used internationallyA50This abbreviation replaces, so in the following text, FTSEA50All abbreviated asA50。
A50Latest quotation18960The price is different from2007year12The monthly price is close, which means that the price has already reached nearly14A new high in the year. From a long-term perspective,A50The index has long since changed from2014year2The month reached its lowest point, and the price at that time was6448, with the latest price18960For comparison, the increase is194%That is, it has increased by nearly twice. Compared to the NASDAQ index in the United States during the same period,2014year2Month is3418Current latest price13482, with an increase of294.4%That is, it has increased by nearly three times. In our impression, the US stock market has always been thriving, so it is not surprising that it has tripled. But forAFor the stock market, the common impression is that there is no stable market, either a continuous decline or a sudden drop after a sharp rise. Through recentA50We can understand from the rise of the index that we cannot analyze the current Chinese stock market with old thinking, and it may no longer be the 'big loser'.
Some people will say,A50The sample stocks of the index and the Shanghai Composite Index are not the same,A50The doubling and rising of the index does not mean thatAThere has been a general bull market in the stock market. We can take out the monthly trend chart of the Shanghai Composite Index to observe whether the Chinese stock market is in a bull market or a bear market.

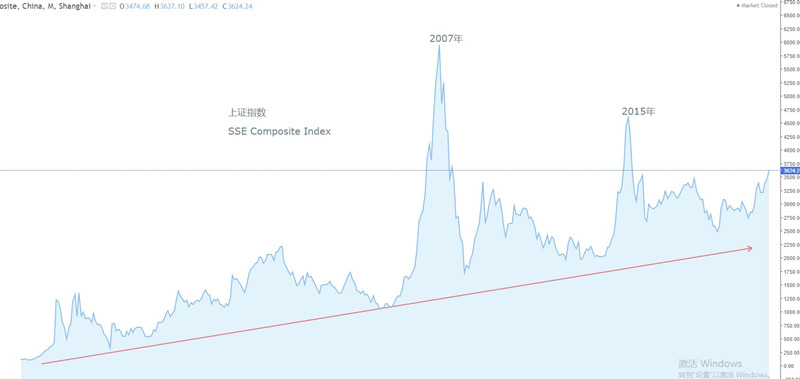
chart2China Shanghai Composite Index Lunar line
Many people's memories linger on2007After the Shanghai Composite Index surged in, it immediately experienced a sharp decline and2015Immediately after the annual surge, there was a sharp decline pattern. Believing that ChinaAThere is no truly stable bull market in the stock market, but due to the high proportion of retail investors, extreme situations of "crazy bull" and "stock disaster" alternate. We can observe the red upward trend line in the figure above, which has been recorded since the Shanghai Composite Index(1990Since the beginning of the year, its periodic highs have indeed fluctuated, but its periodic lows have steadily risen. include2007Year and2015After the stock market crash in, although experiencing80%The above major declines did not break through the previous lows. This also means that ChinaAThe stock market has always been in a slow bull market of "another model". The reason for saying 'another model' is because everyone is very familiar with the bull market model of the US stock market, which is a small pullback+Slight increase. However, China's slow moving bull has its own characteristics, as it belongs to the category of significant ups and downs+A bull market pattern where the bottom slowly rises. The reason for this phenomenon may beAThe hype atmosphere in the stock market is even stronger. When a wave of market conditions arrives, a large number of off market funds pour in, causing real-time prices to seriously deviate from the fundamentals of listed companies and the national economy. After the foam reached its peak, there was no accident that the market fell sharply. The funds that followed the trend before entered the market have once again started a "scurrying" flight. But there are always those long-term fundsAAfter the stock fell to the value line, it started a buying mode, thus achieving the Shanghai Composite Index and FTSEA50The index has risen at the bottom for decades.
Of course, most traders are not satisfied with their operationsstock market indexfuturesThe qualification is due to its high transaction threshold requirements.MT4Among themCHI50The index can precisely serve as the trading target for such a group of traders, as its trend is similar to that of ChinaAThe trend of the stock market is basically the same. The Chinese proverb once said, 'Know yourself and your enemy, you will never be defeated in a hundred battles.' In tradingCHI50Before indexing, traders must understand the trading rules related to the index. Next, we will focus onCHI50Index for science popularization introduction.
FushiA50The stock selection criteria are very simple, and the core indicator is the total market value: all stocks listed on the Shanghai Stock Exchange and Shenzhen Stock Exchange, Top by Market Value50homeAListed companies are included in the index. Listing location in Singapore, type futures(MT4InCHI50byCFDContract), with monthly cash delivery. Trading time is in the morning Beijing time9PM - PM4spot30Minute and afternoon5From midnight to early morning of the next day4spot45Points, totaling nearly20Hours. The limit on price up and down is: when the price rises or falls compared to the settlement price on the previous trading day10%When, there will be10Minute cooldown period(Limited to+/-10%within)When the price rises or falls compared to the settlement price on the previous trading day15%When, there will be10Minute cooldown period(Limited to+/-15%within). Thereafter, no price restrictions will be set for the remaining time of the trading day, and there will be no price limit on the last trading day when the contract expires.
FushiA50The index has the following5Big advantage:
1In ChinaAThe only offshore index futures related to the stock market
2Strong liquidity, up to daily30A transaction volume of 100 million US dollars*
3, with Shanghai and Shenzhen, China300The trend of stock index futures is highly correlated
4Nearly daily20Hour trading time
5Denominated in US dollars
For the third advantage, we have more detailed data support:
FushiA50index 30day 60day 1year
Shanghai and Shenzhen300index 93.3% 94.4% 94.5%
surface1FushiA50Index and Shanghai and Shenzhen300Summary of Index Correlation Coefficients
The larger the correlation coefficient, the better the resonance between the two. up to90%The above correlation coefficients represent the operating rich timeA50Index and Operation Shanghai and Shenzhen300There is basically no difference in the index.
Disclaimer:
1The above analysis only represents the analyst's perspective. There are risks in the foreign exchange market and investment needs to be cautious.
2、ATFXWe will not be responsible for any profit or loss that may arise from the direct or indirect use or reliance on this information.
|
"Small gifts, come to Huiyi to support me"
No one has offered a reward yet. Give me some support
|