Register now, make more friends, enjoy more functions, and let you play in the community easily.
You need Sign in Can be downloaded or viewed without an account?Register Now 
x
A symmetrical triangle refers to a gradual contraction of the diagonal connecting the highest and lowest prices towards a point, It looks like a triangle. During the formation of this model, The highest price in the market is constantly decreasing, The lowest price continues to rise; That is to say, neither the buying price nor the selling price has been able to drive a clear trend in prices, Both sides are evenly matched.Please refer to the picture above, Both the buying and selling prices failed to further break through the price, The upward and downward diagonal lines of the trend gradually approach, Breakthrough is imminent. We cannot determine in which direction the market will break through, But what we can confirm is that, There will definitely be a breakthrough, after all, Either the buying or selling price will eventually give up.
that, How should we use this model? very simple, Just hang the purchase order above the upper slash, And hang the sales order below the diagonal line, In this way, no matter which direction the market breaks through, We can all capture profits.In this example, If we place a purchase order above the diagonal line, You can obtain a good return; On the other hand, As long as the purchase order is completed, We can cancel the sales order below the slash.
Thank you for your continuous support GKFX PrimeSupport and Trust If you would like to learn more detailed information You can contact us through the following methods We will wholeheartedly serve you Telephone:15801181351 QQ: 2220083555 Scan code to add customer service WeChat | 

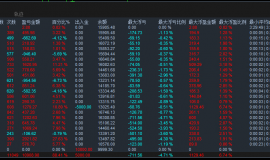
 【顺势突破】黄金智能交易系统
这不是一套依靠重仓搏单边的“暴力EA”,而是一套极其稳健且逻辑清晰的趋势突破策略。
【顺势突破】黄金智能交易系统
这不是一套依靠重仓搏单边的“暴力EA”,而是一套极其稳健且逻辑清晰的趋势突破策略。
 Aurra Markets:【欧元兑美元走势分
欧元兑美元的反弹是多头陷阱,还是趋势反转信号?在美联储决定维持利率不变后,欧元
Aurra Markets:【欧元兑美元走势分
欧元兑美元的反弹是多头陷阱,还是趋势反转信号?在美联储决定维持利率不变后,欧元
 Aurra Markets:亚马逊第二季度营收
亚马逊 2026 年第二季度的业绩表现如何?亚马逊在2026年第二季度交出了令人瞩目的营
Aurra Markets:亚马逊第二季度营收
亚马逊 2026 年第二季度的业绩表现如何?亚马逊在2026年第二季度交出了令人瞩目的营
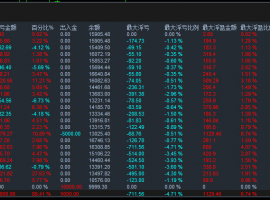
 【无敌黄金】一单一结
bookEAbyMT4平台专属现货黄金自动化交易程序,核心采用严格一单一结机制,同一时段仅持
【无敌黄金】一单一结
bookEAbyMT4平台专属现货黄金自动化交易程序,核心采用严格一单一结机制,同一时段仅持
 Aurra Markets:【白银走势分析】银
Silver breakthrough 60 美元后的涨势能否持续?白银(XAG/USD)近期出现大幅跳空上涨,主要受
Aurra Markets:【白银走势分析】银
Silver breakthrough 60 美元后的涨势能否持续?白银(XAG/USD)近期出现大幅跳空上涨,主要受


 Riser card
 Top card
 Silence card
 Color changing card
 lifting jack