Register now, make more friends, enjoy more functions, and let you play in the community easily.
You need Sign in Can be downloaded or viewed without an account?Register Now 
x
Yang Jiayi:11.4gold投资指标硬货,三大技术指标涵盖行情动态!
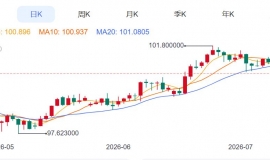
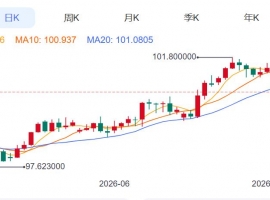
投资者在分析黄金价格行情走势时,需要结合基本面和技术分析进行方向判断,所以如何读懂K线图成了新手们问得最多的问题。在炒黄金的道路上,观察黄金价格走势K线图的走势是一个最直接有效的方法。如何分析黄金投资K线图三大技术指标,准确掌握行情动态?
1MACDindex

在现货黄金投资中,最常用的有黄金投资MACDIndicators,MACDThe indicator is formed by combining two lines and one column, and the fast line isDIFThe slow line isDEAThe bar chart showsMACDThe principle is that it can analyze the changes in the balance of power between buyers and sellers during the rise and fall of gold prices, and investors can judge the development of market trends based on this, which is more applicable in unilateral markets.MACD指标的买卖原则为:
1、MACDstay0Above the axis, it represents a bullish market, representing a strong bullish position. Currently, there are more bullish people, and multiple parties occupy a dominant position. The stronger the energy column signal, the stronger the driving force of the market.
2、MACDstay0Below the axis, there is a bearish market, representing a strong bearish position. Currently, there are more bearish people, and the bearish side dominates. The stronger the energy column signal, the stronger the driving force of the market.
3、DIFLine andKIf the line deviates, there may be a reversal signal in the market.
4、MACDGolden fork:DIFBreakthrough from bottom to topDEA,For buying signals.
5、MACDDead fork:DIFBreakthrough from top to bottomDEA,For selling signals.
二、KDJindex

Spot goldkdjIndicator, which mainly uses the true amplitude of price fluctuations to reflect the phenomenon of overbought and oversold price trends, is a technical tool that sends buying and selling signals before prices have yet to rise or fall. Its main purpose of analysis is to clearly demonstrate the potential trends of the gold investment market, especially in volatile markets.Kdj指标的买卖原则
1、KdjIndicator in50A long market with a range or above.RSIThe closer the indicators are100The more severe the signs of overbought, the selling signal.
2、KdjIndicator in50Within a range or below, it is a bearish market.RSIThe closer the indicators are0The more severe the signs of oversold are, it is a buying signal.
3Gold Cross: When the precious metal market undergoes a long period of low consolidation, andK、D、JAll three lines are in50When below the line, onceJLine andKThe line almost simultaneously breaks upwardsDLine time indicates that the market is about to strengthen and the decline has ended, indicating a buying signal.
4Death crossing: When the precious metal market has experienced a long period of upward trend in the early stage and the increase has been significant, onceJLine andKLine in high order(80above)Almost simultaneous downward breakthroughDLine time indicates that the market is about to turn from strong to weak, which is a selling signal.
3、 Bollinger Belt Index

布林带指标可适用于单边行情及震荡行情中,在所有炒黄金看盘的指标中,功能尤其强大、加上对行情的判断准确,是现时投资者使用率最高、最实用的一向技术指标。
1In a unilateral market, the upper track of the Bollinger band is a pressure line, and as long as the market has not yet reached the upper track high point, one can hold multiple orders. If the market touches the upper track high point of the Bollinger band and is subjected to counter pressure from the upper track, the market will fall back and fall;The lower track of the Bollinger band is the support line, and as long as the market has not yet reached the lower track low point, one can hold short orders. If the market reaches the lower track low point of the Bollinger band and is supported by the lower track, the market will support an upward trend.
2In a volatile market - the middle track of the Bollinger Belt is the average price line in a volatile market. In a volatile market, when the market breaks through the middle track of the Bollinger belt upwards, the price of precious metals will rise above the horizontal line;When the market goes down and crosses the middle track of the Bollinger band, the price of precious metals will fall below the horizontal line. Both are a way to break through the market.
其实黄金投资基础知识非常之广泛以及海量其中包括了黄金市场交易规则、交易理论基础、交易操作等等,投资者需要在黄金市场屡屡前行,所以黄金投资基础知识是必须要掌握的,等到基础知识的底蕴越来深厚,盈利也就近在咫尺了!

责任编辑:杨嘉壹(微信:yjy2658)
作者寄言:投资有风险,入市需谨慎
|
"Small gifts, come to Huiyi to support me"
No one has offered a reward yet. Give me some support
|
|
Yang Jiayi, a first-class gold analyst, is skilled in precise layout of band trading. He uses his own future time turning system to accurately determine the time turning points of market highs and lows in advance, and in combination with precise point picking method and small stop loss to win super returns and losses1Yingying10to100Unequally high breakeven ratio excess returns.
|

 ZFXShanhai Securities: Gold Price4000关口上方拉锯
PPI数据迅速缓解了投资者对美联储激进加息的担忧,推动金价一度升至4080美元附近,随
ZFXShanhai Securities: Gold Price4000关口上方拉锯
PPI数据迅速缓解了投资者对美联储激进加息的担忧,推动金价一度升至4080美元附近,随
 Aurra Markets:【欧元兑美元走势展
是什么因素在推动欧元兑美元汇率走势?美联储与欧洲央行之间正因通胀走势分化而出现
Aurra Markets:【欧元兑美元走势展
是什么因素在推动欧元兑美元汇率走势?美联储与欧洲央行之间正因通胀走势分化而出现
 Aurra Markets:PayPal 飙涨,苹果创
今日哪些股票波动最大?为何值得市场关注?今日美股午盘交易时段,多只热门个股出现
Aurra Markets:PayPal 飙涨,苹果创
今日哪些股票波动最大?为何值得市场关注?今日美股午盘交易时段,多只热门个股出现
 Aurra Markets:【黄金走势分析】3,9
黄金的涨是“多头陷阱”还是新的“上涨基础”?美国 CPI 数据低于市场预期后,黄金
Aurra Markets:【黄金走势分析】3,9
黄金的涨是“多头陷阱”还是新的“上涨基础”?美国 CPI 数据低于市场预期后,黄金
 Aurra Markets:IBM 股价为何在第二
IBM 股价为何暴跌逾 20%?IBM 近日公布的第二季度财报显示,其业绩远低于华尔街预期
Aurra Markets:IBM 股价为何在第二
IBM 股价为何暴跌逾 20%?IBM 近日公布的第二季度财报显示,其业绩远低于华尔街预期


 Riser card
 Top card
 Silence card
 Color changing card
 lifting jack