"Small gifts, come to Huiyi to support me"
No one has offered a reward yet. Give me some support
| |
 ZFXShanhai Securities: Gold Price4000关口上方拉锯
PPI数据迅速缓解了投资者对美联储激进加息的担忧,推动金价一度升至4080美元附近,随
ZFXShanhai Securities: Gold Price4000关口上方拉锯
PPI数据迅速缓解了投资者对美联储激进加息的担忧,推动金价一度升至4080美元附近,随
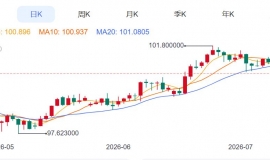
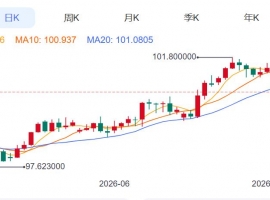
 Aurra Markets:【欧元兑美元走势展
是什么因素在推动欧元兑美元汇率走势?美联储与欧洲央行之间正因通胀走势分化而出现
Aurra Markets:【欧元兑美元走势展
是什么因素在推动欧元兑美元汇率走势?美联储与欧洲央行之间正因通胀走势分化而出现
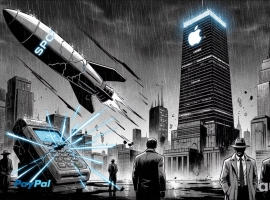 Aurra Markets:PayPal 飙涨,苹果创
今日哪些股票波动最大?为何值得市场关注?今日美股午盘交易时段,多只热门个股出现
Aurra Markets:PayPal 飙涨,苹果创
今日哪些股票波动最大?为何值得市场关注?今日美股午盘交易时段,多只热门个股出现
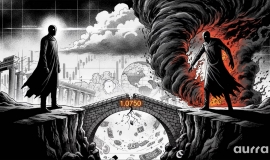
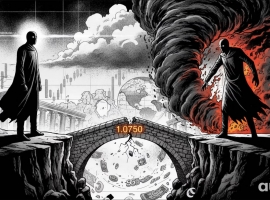
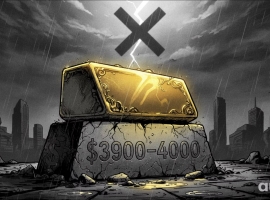 Aurra Markets:【黄金走势分析】3,9
黄金的涨是“多头陷阱”还是新的“上涨基础”?美国 CPI 数据低于市场预期后,黄金
Aurra Markets:【黄金走势分析】3,9
黄金的涨是“多头陷阱”还是新的“上涨基础”?美国 CPI 数据低于市场预期后,黄金
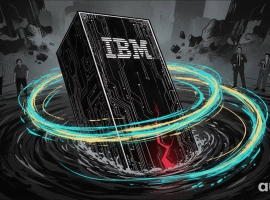 Aurra Markets:IBM 股价为何在第二
IBM 股价为何暴跌逾 20%?IBM 近日公布的第二季度财报显示,其业绩远低于华尔街预期
Aurra Markets:IBM 股价为何在第二
IBM 股价为何暴跌逾 20%?IBM 近日公布的第二季度财报显示,其业绩远低于华尔街预期
MIP|Mobile version|A small dark room| |Site Map |customer serviceQQ:2381682638
Copyright © 2006-2024 Huiyi Interaction https://www.forexbbs.net copyright All Rights Reserved.


 ​
​ Riser card
 Top card
 Silence card
 Color changing card
 lifting jack