Register now, make more friends, enjoy more functions, and let you play in the community easily.
You need Sign in Can be downloaded or viewed without an account?Register Now 
x
Jin Yunlan: FriedgoldThere are countless technical analysis indicators, and these four are the ones that are simple and easy to use
When you embark on a trading journey, you are likely to encounter numerous technical indicators. However, most trading opportunities can be easily identified through any of these four technical indicators.

Learn how to flexibly apply the moving average(MovingAverage)Relative strength indicators(RSI)Random indicators(Stochastic)Exponential Smoothing Similarities and Differences Mean Line(MACD)It will be very beneficial for your trading path. It's like mastering a strengthening tool and using these technical indicators to learn the method of transaction recognition.
————The Benefits of Simple Strategies
Traders are startingforeign exchangeWhen traveling to the market, things are often complicated. This fact is unfortunate but cannot be denied as correct.Although traders instinctively feel that adding many tools to complex strategies is better, they should actually focus on how to make trading strategies as simple as possible. This is because a simple strategy allows traders to trade faster and more easily.
A simpleForeign exchange transactionsThe best foreign exchange technical indicators required for strategy
Establishing a trading plan that covers a small number of technical indicators and usage rules is a way to simplify trading.To achieve this, four simple indicators are listed below, and you can proficiently use one or two of them to identify trading entry and exit points.Follow Jin Yunlan(JYL7628)Keep up with market information and grasp major trends to help you make steady profits!
·MACDindex(Exponential Smoothing Difference Average)
·Moving average(Simple Moving Average,MA/MVA)
·RSIindex(Relative strength index)
·Slow speedKDindex(Slow Random Indicator,SKDJ)
Once you start trading with a real account, a simple plan and rules will be an extremely important fortress for you.

Using foreign exchange technical indicators to analyze market trends in different market environments
There are too many fundamental factors that affect the value of one currency against another. Many traders choose to use foreign exchange indicators in trend charts to identify trading opportunities.
When analyzing the chart, you may have noticed two common market environments. One of these two environments is a range market with strong support and resistance levels, while the other is a market with a clear upward or downward trend.
Through technical analysis, traders can determine whether the current market is in a range or trend, and based on this, identify entry or exit points with a higher probability.Analyzing the signals given by indicators is as simple as placing them in a trend chart.Follow Jin Yunlan(JYL7628)Keep up with market information and grasp major trends to help you make steady profits!
| ————Trading using moving averages |
The moving average is one of the best foreign exchange indicators for any strategy.The moving average makes it easier for traders to follow the overall trend and determine trading opportunities. When the market is brewing a trend trend, you can use one or more moving averages to identify the trend and buy or sell at the appropriate time.
The calculation method of the moving average is relatively simple. The moving average is formed by connecting the average prices of exchange rates over a certain period in sequence, for example, it can be calculated based on200Determine the overall trend based on price fluctuations of days or a year. While using the moving average to identify trading opportunities, one can also choose entry and exit times based on momentum, that is, entering and exiting in the opposite direction.

| ————UsingRSITrading with indicators |
Relative strength index/RSIAn indicator is a type of volatility indicator, one of its functions is to identify whether it is in an overbought or oversold state and the potential for reversal.For traders who tend to buy low and sell high,RSIThe indicators may be very useful.
RSIIndicators can better indicate the timing of entry and exit in both trend and range markets. When the market lacks directional guidance and falls into range fluctuations, you can obtain buy or sell signals similar to those shown in the above figure. When the market enters a trend type, the indicator releases a clearer signal, and you can trade with the trend when the indicator steps out of its extreme value.Follow Jin Yunlan(JYL7628)Keep up with market information and grasp major trends to help you make steady profits!
RSIIt is a fluctuation indicator with values located in0~100Between. Approaching100Time is overbought, approaching0When it's oversold. When the upward trend restartsRSICoincidentally located in30Below, traders can access theRSIStep in when stepping out of the oversold area.
| ————Trading using random indicators |
Slow random indicators andRSIIndicators are also considered oscillatory indicators, one of their functions is to identify the market being in an overbought or oversold state and the potential for reversal.The unique feature of random indicators is the use of two lines-%Kand%DThe lines work together to release the entry signal.
Due to being both shock indicators, there are similar overbought and oversold areas. Simply put, it can be achieved throughKThe line is rising20When passing horizontally upwards, pass through it togetherDLine to confirm if it is a strong buying signal.
| ————Using Exponential Smoothing of Similarities and Differences Averages/MACDConduct transactions |
MACDIndicators are sometimes considered the king of volatility indicators and can play a good role in trend and interval markets, as their use of the moving average provides an intuitive display of changes in momentum.
When you identify whether the market environment is volatile or trendy, there are two things to note: first, identifyMACDThe relationship between the two lines in to determine whether the current trend is towards an upward or downward trend; Secondly, you can useMACDThe line (red line) crosses the signal line (blue line) up and down to give buying and selling signals.

Like all indicators,MACDIndicators are very suitable for identifying market trends and range fluctuations. Once you identify the trend, it's best to useMACDFurther confirmation is made by crossing the lines. When trading, you can set the stop loss below the recent price extreme before the intersection, and the stop gain point is twice the stop loss point.
There is a saying that goes: profits can always take care of themselves, and losses will never end on their own. If you don't set a stop loss, the losses will only remain in your account, like a cancer that makes you feel uncomfortable. When the meat had to be cut in the end, the loss at this point was much greater than the original stop loss value, and this account was actually not cost-effective. If you are in such a cycle, please stop and think carefully, summarize your experience and lessons, and then send it out as a whole!
​
Editor of this article: Jin Yunlan
VX:JYL7628Deduction:2766/755/715 |
"Small gifts, come to Huiyi to support me"
No one has offered a reward yet. Give me some support
|

 Aurra Markets:【黄金走势分析】3,9
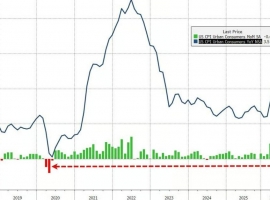
黄金的涨是“多头陷阱”还是新的“上涨基础”?美国 CPI 数据低于市场预期后,黄金
Aurra Markets:【黄金走势分析】3,9
黄金的涨是“多头陷阱”还是新的“上涨基础”?美国 CPI 数据低于市场预期后,黄金
 Aurra Markets:IBM 股价为何在第二
IBM 股价为何暴跌逾 20%?IBM 近日公布的第二季度财报显示,其业绩远低于华尔街预期
Aurra Markets:IBM 股价为何在第二
IBM 股价为何暴跌逾 20%?IBM 近日公布的第二季度财报显示,其业绩远低于华尔街预期
 Aurra Markets 借 2026 年阿布扎比金
阿联酋阿布扎比,2026 year 7 month 15 day —— 全球多资产差价合约经纪商 Aurra Markets
Aurra Markets 借 2026 年阿布扎比金
阿联酋阿布扎比,2026 year 7 month 15 day —— 全球多资产差价合约经纪商 Aurra Markets
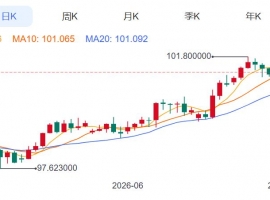
 ZFX山海证券:金价反弹至4050Nearby!
Tuesday(7month14日),全球黄金市场经历了一场惊心动魄的过山车行情。现货黄金在盘中一度
ZFX山海证券:金价反弹至4050Nearby!
Tuesday(7month14日),全球黄金市场经历了一场惊心动魄的过山车行情。现货黄金在盘中一度
 ZFX山海证券:金价下跌近3%!
Monday(7month13日)现货黄金价格连续第二个交易日大幅下跌,收报每盎司4000.80USD, decline
ZFX山海证券:金价下跌近3%!
Monday(7month13日)现货黄金价格连续第二个交易日大幅下跌,收报每盎司4000.80USD, decline


 Riser card
 Top card
 Silence card
 Color changing card
 lifting jack