Register now, make more friends, enjoy more functions, and let you play in the community easily.
You need Sign in Can be downloaded or viewed without an account?Register Now 
x
胡金奕:现货goldInvestment Techniques,这三大指标对趋势掌握很重要!
目前越来越多投资者加入了现货黄金投资这个市场中,所以随之而来的就是对现货黄金投资技巧的学习了。不过就像是市场变化一样,虽然很多时候行情变化多端,但有些最基本的东西是不会变的,这些都是投资理财的关键点,不过就算是最简单的产品也有着相应的技巧,更何况是跟我们息息相关的现货黄金呢?
现货黄金投资技巧goldK线指标——MACDindex
在现货黄金投资中,最常用的有黄金投资MACDIndicators,MACDThe indicator is formed by combining two lines and one column, and the fast line isDIFThe slow line isDEAThe bar chart showsMACDThe principle is that it can analyze the changes in the balance of power between buyers and sellers during the rise and fall of gold prices, and investors can judge the development of market trends based on this, which is more applicable in unilateral markets.
MACD指标的买卖原则为:
1、MACDstay0Above the axis, it represents a bullish market, representing a strong bullish position. Currently, there are more bullish people, and multiple parties occupy a dominant position. The stronger the energy column signal, the stronger the driving force of the market.
2、MACDstay0Below the axis, there is a bearish market, representing a strong bearish position. Currently, there are more bearish people, and the bearish side dominates. The stronger the energy column signal, the stronger the driving force of the market.
3、DIFLine andKIf the line deviates, there may be a reversal signal in the market.
4、MACDGolden fork:DIFBreakthrough from bottom to topDEA,For buying signals.
5、MACDDead fork:DIFBreakthrough from top to bottomDEA,For selling signals.
现货黄金投资技巧goldK线指标——KDJindex
现货白银、现货黄金kdjIndicator, which mainly uses the true amplitude of price fluctuations to reflect the phenomenon of overbought and oversold price trends, is a technical tool that sends buying and selling signals before prices have yet to rise or fall. Its main purpose of analysis is to clearly demonstrate the potential trends of the gold investment market, especially in volatile markets.
Kdj指标的买卖原则
1、KdjIndicator in50A long market with a range or above.RSIThe closer the indicators are100The more severe the signs of overbought, the selling signal.
2、KdjIndicator in50Within a range or below, it is a bearish market.RSIThe closer the indicators are0The more severe the signs of oversold are, it is a buying signal.
3Gold Cross: When the precious metal market undergoes a long period of low consolidation, andK、D、JAll three lines are in50When below the line, onceJLine andKThe line almost simultaneously breaks upwardsDLine time indicates that the market is about to strengthen and the decline has ended, indicating a buying signal.
4Death crossing: When the precious metal market has experienced a long period of upward trend in the early stage and the increase has been significant, onceJLine andKLine in high order(80above)Almost simultaneous downward breakthroughDLine time indicates that the market is about to turn from strong to weak, which is a selling signal.
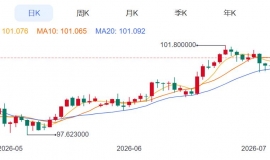
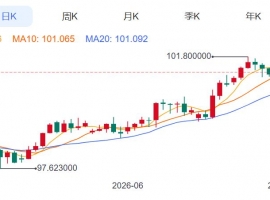
现货黄金投资技巧goldK线指标——布林带指标
布林带指标可适用于单边行情及震荡行情中,在所有炒白银、炒黄金看盘的指标中,功能尤其强大、加上对行情的判断准确,是现时投资者使用率最高、最实用的一向技术指标。
1In a unilateral market, the upper track of the Bollinger band is a pressure line, and as long as the market has not yet reached the upper track high point, one can hold multiple orders. If the market touches the upper track high point of the Bollinger band and is subjected to counter pressure from the upper track, the market will fall back and fall;The lower track of the Bollinger band is the support line, and as long as the market has not yet reached the lower track low point, one can hold short orders. If the market reaches the lower track low point of the Bollinger band and is supported by the lower track, the market will support an upward trend.
2In a volatile market - the middle track of the Bollinger Belt is the average price line in a volatile market. In a volatile market, when the market breaks through the middle track of the Bollinger belt upwards, the price of precious metals will rise above the horizontal line;When the market goes down and crosses the middle track of the Bollinger band, the price of precious metals will fall below the horizontal line. Both are a way to break through the market.
​
到这里,真诚的感谢每一位投资朋友能驻足片刻浏览金奕的文章,积少成多的学习,总有一天你也能成为交易高手,更多详细的现货黄金投资技巧goldK线指标基础知识,形态讲解,可持续关注胡金奕文章,胡金奕现货黄金投资技巧goldK线指标知识课堂将持续更新,并为你们进行讲解,同时每日K线测评也将同步上线,单线胡金奕即可参与!关注工纵好胡金奕即可有机会获得实时操作建议、中线布局计划一份!
Wen/Hu Jinyi【 WeChat:HJY8576 】 |
"Small gifts, come to Huiyi to support me"
No one has offered a reward yet. Give me some support
|

 ZFX山海证券:金价下跌近3%!
Monday(7month13日)现货黄金价格连续第二个交易日大幅下跌,收报每盎司4000.80USD, decline
ZFX山海证券:金价下跌近3%!
Monday(7month13日)现货黄金价格连续第二个交易日大幅下跌,收报每盎司4000.80USD, decline
 Aurra Markets:【布伦特原油走势分
地缘政治能否推动布伦特原油升至 85 美元?随着中东紧张局势持续升温,布伦特原油正
Aurra Markets:【布伦特原油走势分
地缘政治能否推动布伦特原油升至 85 美元?随着中东紧张局势持续升温,布伦特原油正
 Aurra Markets:美国打击伊朗140处目
美国军事行动如何影响霍尔木兹海峡石油运输?据报道,上周日有超过 800 万桶原油顺利
Aurra Markets:美国打击伊朗140处目
美国军事行动如何影响霍尔木兹海峡石油运输?据报道,上周日有超过 800 万桶原油顺利
 7month14日午后黄金策略:金价反弹至403
消息面上,黄金昨天经历接近3%的明显下跌后,今天从低位展开反弹,一度重新回到
7month14日午后黄金策略:金价反弹至403
消息面上,黄金昨天经历接近3%的明显下跌后,今天从低位展开反弹,一度重新回到
 ZFX山海证券:金价低开失守4100dollar
当前油价飙升引发的通胀担忧与美联储加息预期强化,却让黄金短期内难以发挥避险光环,
ZFX山海证券:金价低开失守4100dollar
当前油价飙升引发的通胀担忧与美联储加息预期强化,却让黄金短期内难以发挥避险光环,


 Riser card
 Top card
 Silence card
 Color changing card
 lifting jack