"Small gifts, come to Huiyi to support me"
No one has offered a reward yet. Give me some support
| |
 国内伦敦金正规平台排名(2026最新榜
在贵金属投资市场持续升温的背景下,国内伦敦金交易因其24小时双向交易、杠杆灵活等特
国内伦敦金正规平台排名(2026最新榜
在贵金属投资市场持续升温的背景下,国内伦敦金交易因其24小时双向交易、杠杆灵活等特
 金马贺岁 新春有礼|金荣中国五重豪
马蹄踏春至,福暖启新章。当新春的烟火点亮万家灯火,当财富的期许萦绕心头,金荣中国
金马贺岁 新春有礼|金荣中国五重豪
马蹄踏春至,福暖启新章。当新春的烟火点亮万家灯火,当财富的期许萦绕心头,金荣中国
 香港打造国际黄金交易中心,金荣中国
2026year1月,国际金价一度攀升至5598dollar/盎司的历史峰值,黄金作为终极价值储备的地位
香港打造国际黄金交易中心,金荣中国
2026year1月,国际金价一度攀升至5598dollar/盎司的历史峰值,黄金作为终极价值储备的地位
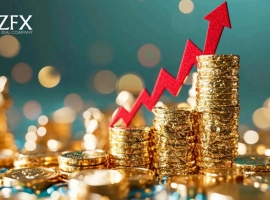
 ZFX山海证券:警惕!金价连续下跌!
全球金市周四遭遇显著抛压,金价下跌,主要受美元走强及金融市场整体避险情绪升温影响
ZFX山海证券:警惕!金价连续下跌!
全球金市周四遭遇显著抛压,金价下跌,主要受美元走强及金融市场整体避险情绪升温影响
 ZFX山海证券:金价冲高回落!多空鏖
Wednesday(2month4日)黄金市场上演了一出惊心动魄的“过山车”行情,现货黄金在周三盘中早些
ZFX山海证券:金价冲高回落!多空鏖
Wednesday(2month4日)黄金市场上演了一出惊心动魄的“过山车”行情,现货黄金在周三盘中早些
MIP|Mobile version|A small dark room| |Site Map |customer serviceQQ:2381682638
Copyright © 2006-2024 Huiyi Interaction https://www.forexbbs.net copyright All Rights Reserved.


 Riser card
 Top card
 Silence card
 Color changing card
 lifting jack