Register now, make more friends, enjoy more functions, and let you play in the community easily.
You need Sign in Can be downloaded or viewed without an account?Register Now 
x
crude oilThis week's review
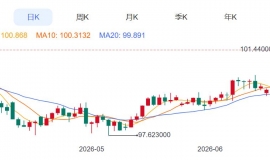
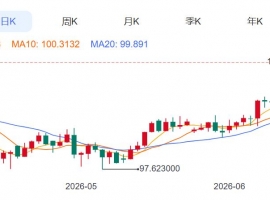
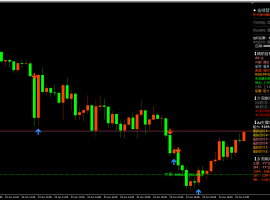
Crude oil weekly chart4Continuous positive, followed by the first negative line, showing signs of gradual decline, with the upper part affected by64.8Suppressing a pullback, looking at the daily chart, a slight correction at the beginning of the week followed by an upward trend64.8Blocked, daily small bullish line, Tuesday opens low and walks low, probing upwards64.8Blocked, the European market is broken64Lowest touch63.68Rebound, with a big pullback in the early morning. The daily chart has taken a bearish candlestick, and on Wednesday, it continues to decline, continuing to decline63.2Supporting rebound, the daily chart closed lower at the bullish line, and Thursday's Asian session was blocked64.3Falling back, eveningEIASignificant bullish trend, short-term upward trend64.18Pullback, daily closing with a cross negative star, Friday morning pullback with a large negative, opening63.7Fallback63.3Shake, break63The lowest integer threshold has been reached62.78Rebound, closing at63.5Nearby, the daily line receives shadow leads

Outlook for Crude Oil Next Week
Crude oil weekly chart4Continuous positive, followed by the first negative line closure, with weakened upward momentum. The daily high closed negative, with the high point continuously moving downwards and the low point continuously hitting new lows, showing a trend of oscillation and weakening4From an hourly perspective,kThe line runs between the middle and lower tracks of the Bollinger Bands, with the band opening downwards. From the indicators,MA5UnderpassMA10Form a dead cross, with the moving averages crossing and circling as a whole, as shown in the attached indicatorsMACDThe green bearish energy column continues to increase in volume,DIFAndDEAForming a dead cross and running well, it will face adjustment in the short term due to the suppression of the middle track of the Bollinger Bands. Therefore, next week's operation will mainly focus on the pullback adjustment, with low and long assisting, and short-term attention above64.0-64.5Suppress, support below62.8-62.5Frontline, break through and follow up with opportunities
I don't have any here100%An accurate order making plan and no zero risk investment plan, but there is a steady return method. Scan orders without fear, and a good mindset can also achieve a good future,Leading the appreciation of positions,Achieve millions of wealth!

Message:
I hope Mengxian's article and operational suggestions can bring you gains and smooth sailing in your future investments. If you have any questions, you can consult me. I am not only a mentor, but also a friend worth making in your life. If you need to learn more about investment knowledge, trading techniques, and operational skills, you can exchange and learn from me.
Teacher Mengxian (official WeChat:mengxian909 QQ:982200437)Proficient in applying wave theoryKBands, Bollinger BandsMACDAnalyzing and predicting market trends. Proficient in using various technical indicators, thus forming a unique risk control system and trading system. If you need mindset guidance, investment plans, and guidance on crude oil,goldFor friends who are interested in investing in precious metals but have no idea where to start, or who have already been in contact but are not ideal, and want to keep up with the stable market layout, please follow "Dream Immortal Teacher". |
"Small gifts, come to Huiyi to support me"
No one has offered a reward yet. Give me some support
|

 ZFX山海证券:金价退守4100USD barrier
全球黄金市场正在经历一场剧烈的调整。周二(6month22日)现货黄金价格大幅下跌1.9%,触
ZFX山海证券:金价退守4100USD barrier
全球黄金市场正在经历一场剧烈的调整。周二(6month22日)现货黄金价格大幅下跌1.9%,触
 Aurra Markets:标普 500 技术性破位
为何标普 500 和纳斯达克指数同步抛售?一轮显著的隔夜跳空下跌,使标普 500 指数与
Aurra Markets:标普 500 技术性破位
为何标普 500 和纳斯达克指数同步抛售?一轮显著的隔夜跳空下跌,使标普 500 指数与
 Aurra Markets:韩国 KOSPI Index plummeting
韩国股市为何遭遇最糟糕交易日之一? 韩国股市近期出现剧烈震荡,股价大幅下跌,引
Aurra Markets:韩国 KOSPI Index plummeting
韩国股市为何遭遇最糟糕交易日之一? 韩国股市近期出现剧烈震荡,股价大幅下跌,引
 原油期货是什么?一篇搞懂WTI、布兰
近年来国际油价如同云霄飞车,剧烈的波动不仅影响着你我的荷包,更吸引了全球投资者的目
原油期货是什么?一篇搞懂WTI、布兰
近年来国际油价如同云霄飞车,剧烈的波动不仅影响着你我的荷包,更吸引了全球投资者的目
 2026year6month23day Evening17:12 金价跌破41
今天这行情真是够刺激的。早上开盘金价还在4190附近晃悠,结果亚盘直接跳水,一
2026year6month23day Evening17:12 金价跌破41
今天这行情真是够刺激的。早上开盘金价还在4190附近晃悠,结果亚盘直接跳水,一


 Riser card
 Top card
 Silence card
 Color changing card
 lifting jack